Tag Archives: China

image_pdfimage_print

Eurasian teal carcass confirmed to be positive for H5N1 virus

     Subsequent to announcing on December 11 that a carcass of a Eurasian teal found in the Mai Po Nature Reserve (MPNR) preliminarily tested positive for the H5 avian influenza (AI) virus, the Agriculture, Fisheries and Conservation Department (AFCD) confirmed the carcass to be positive for the H5N1 AI virus after further laboratory testing, a spokesman for the AFCD said today (December 21).

     The bird carcass was collected earlier at the MPNR. The Eurasian teal is a winter visitor mainly found in the Deep Bay area.

     The spokesman said cleaning and disinfection of visitor facilities including bird hides and a floating boardwalk has been stepped up. A disinfectant carpet has been placed at the entrance of the MPNR for visitors to disinfect the soles of their shoes. In addition, the AFCD is closely monitoring the situation of the birds there and has put up notices to remind visitors to pay attention to personal hygiene.     

     There are no chicken farms within 3 kilometres of where the dead bird was found. The AFCD will remind poultry farmers to strengthen precautionary and biosecurity measures against AI. Pet bird shop owners and licence holders of bird exhibitions will also be reminded to implement proper precautions against AI.

     The spokesman said that the department will closely monitor poultry farms and the wholesale market to ensure that proper precautions against AI have been taken. The department will continue its wild bird monitoring and surveillance.

     “People should avoid personal contact with wild birds and live poultry and their droppings. They should clean their hands thoroughly after coming into contact with them. The public can call 1823 for AFCD’s follow-up if they come across birds suspected to be sick or dead, including the carcasses of wild birds and poultry,” the spokesman said.

     The Food and Environmental Hygiene Department (FEHD) will continue to be vigilant over live poultry stalls. It will also remind stall operators to maintain good hygiene.

     The Department of Health will keep up its health education to remind the public to maintain strict personal and environmental hygiene to prevent AI.

     The AFCD, the FEHD, the Customs and Excise Department and the Police will strive to deter the illegal importation of poultry and birds into Hong Kong to minimise the risk of AI outbreaks caused by imported poultry and birds that have not gone through inspection and quarantine.

     All relevant government departments will continue to be highly vigilant and strictly enforce preventive measures against AI. Health advice about preventing AI is available on the “Avian Influenza Health Advice” page at www.afcd.gov.hk. read more

Dr Sun Yat-sen Museum’s new exhibition reviews development of textbooks, toys and games in 20th century (with photos)

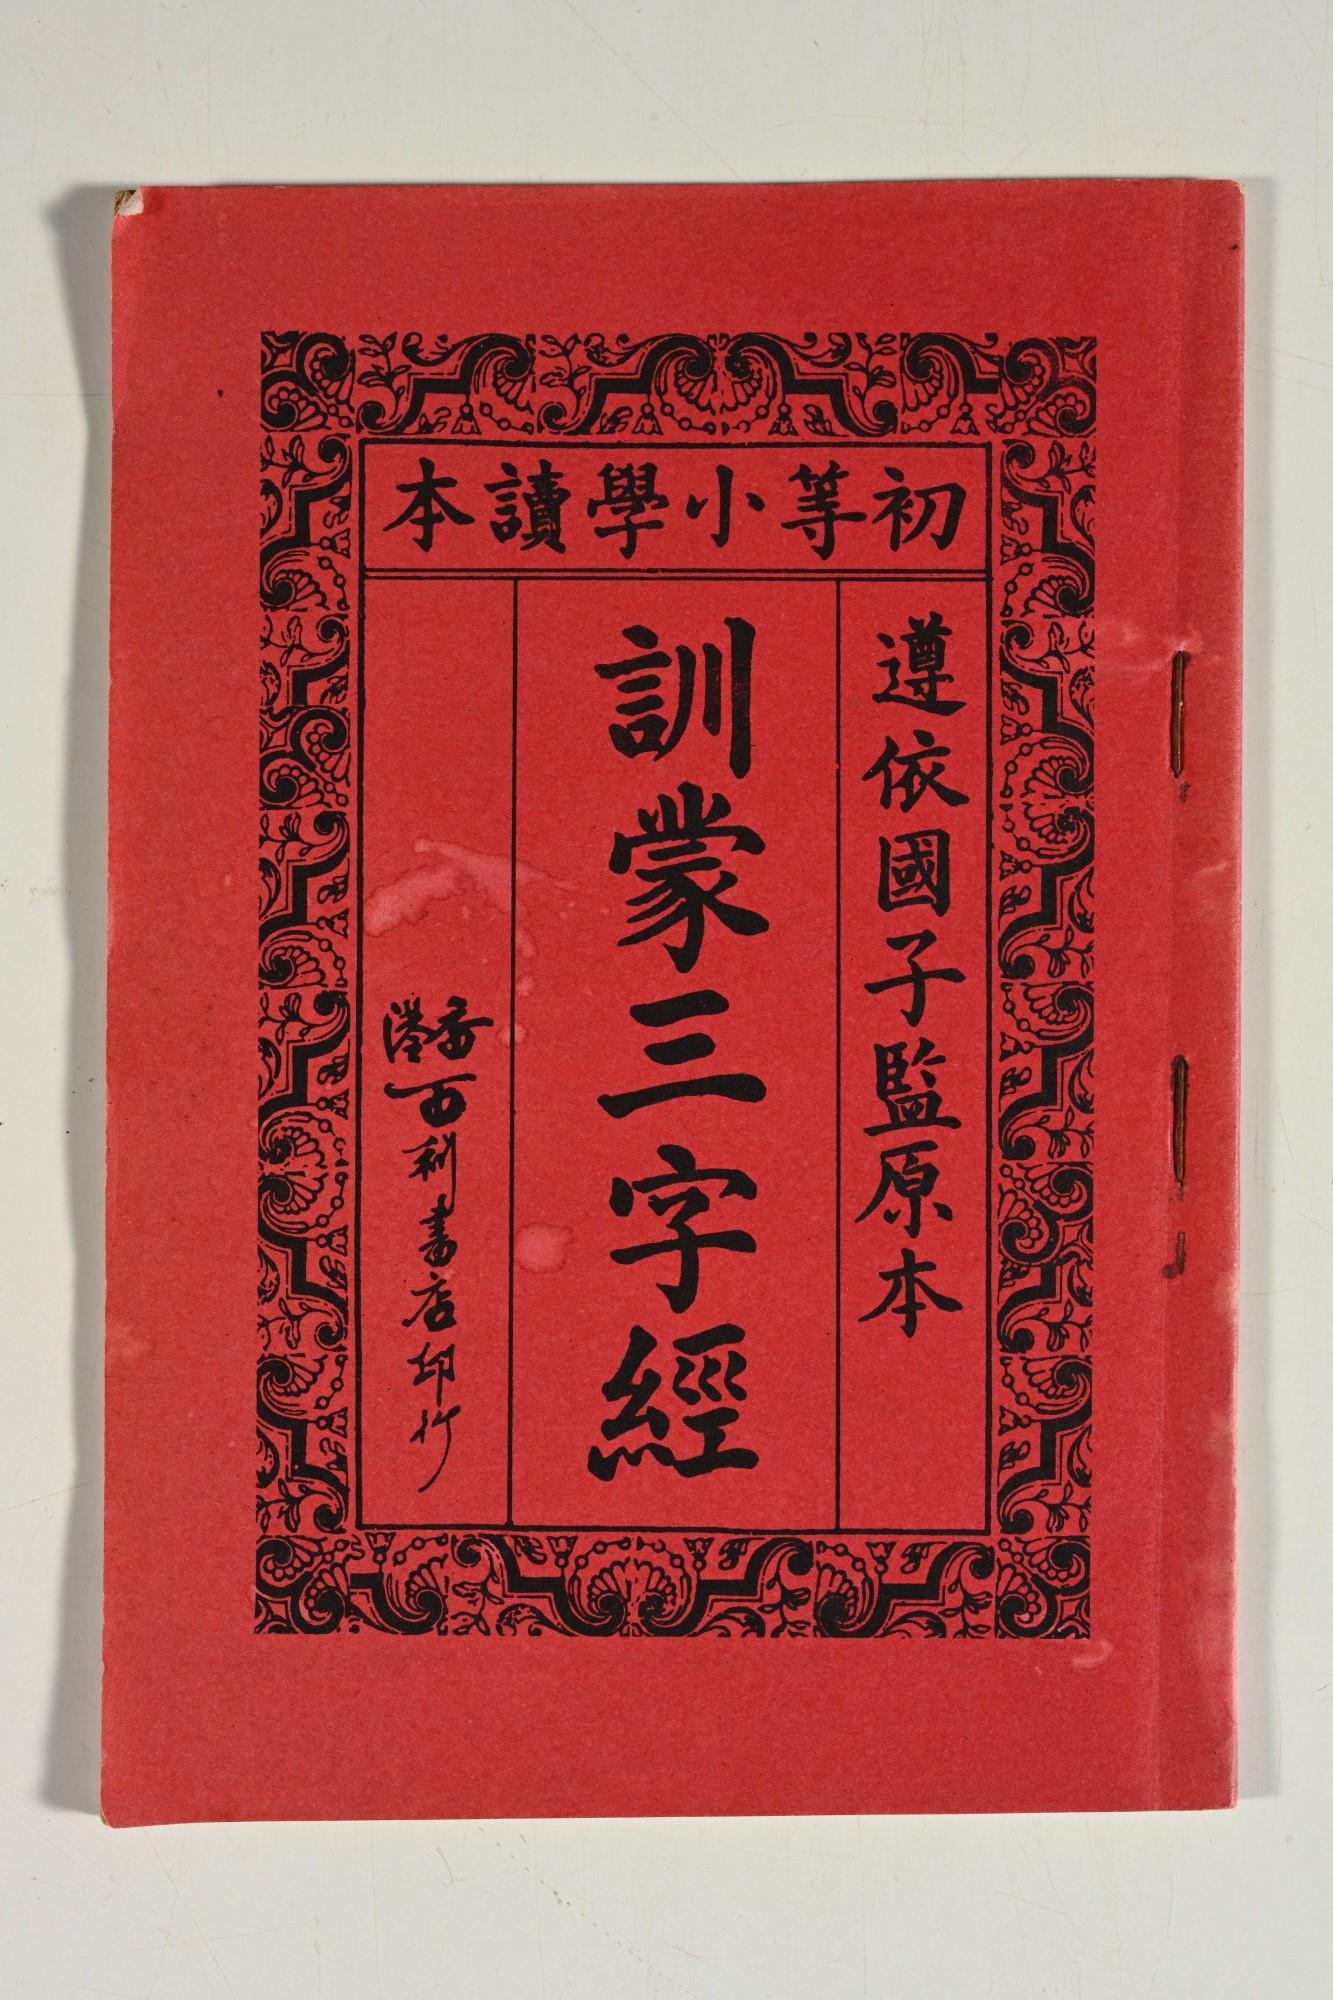
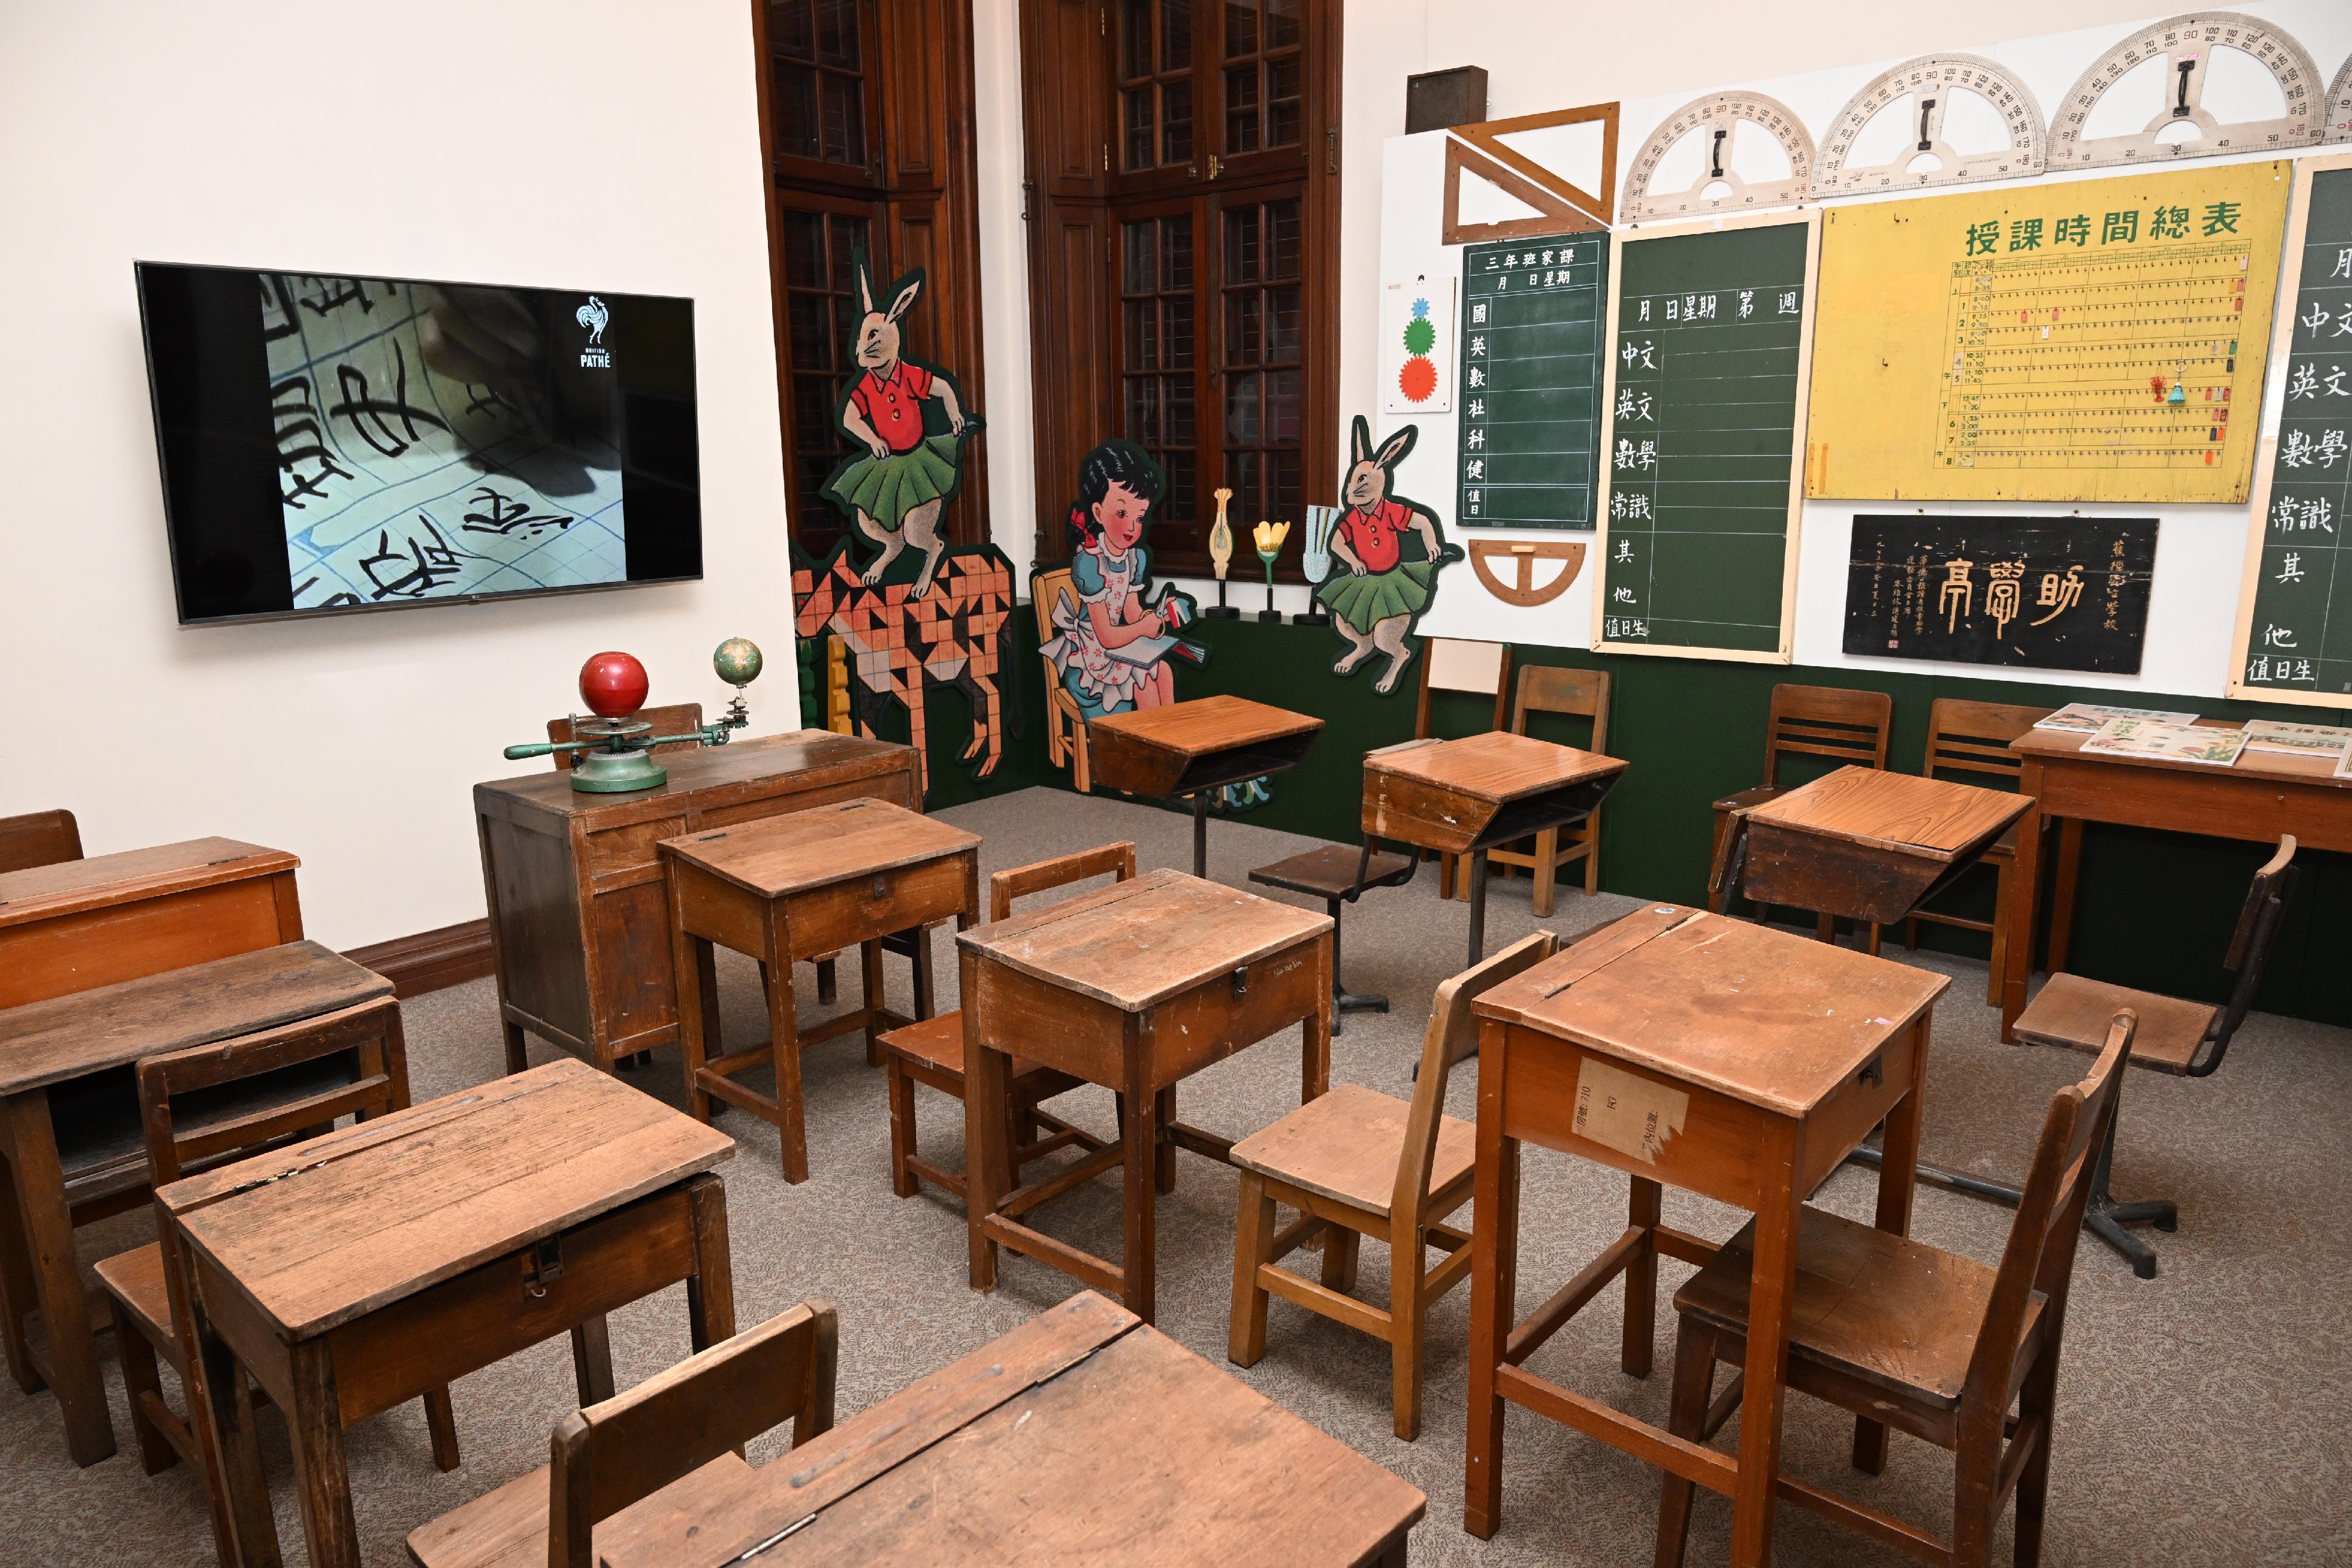
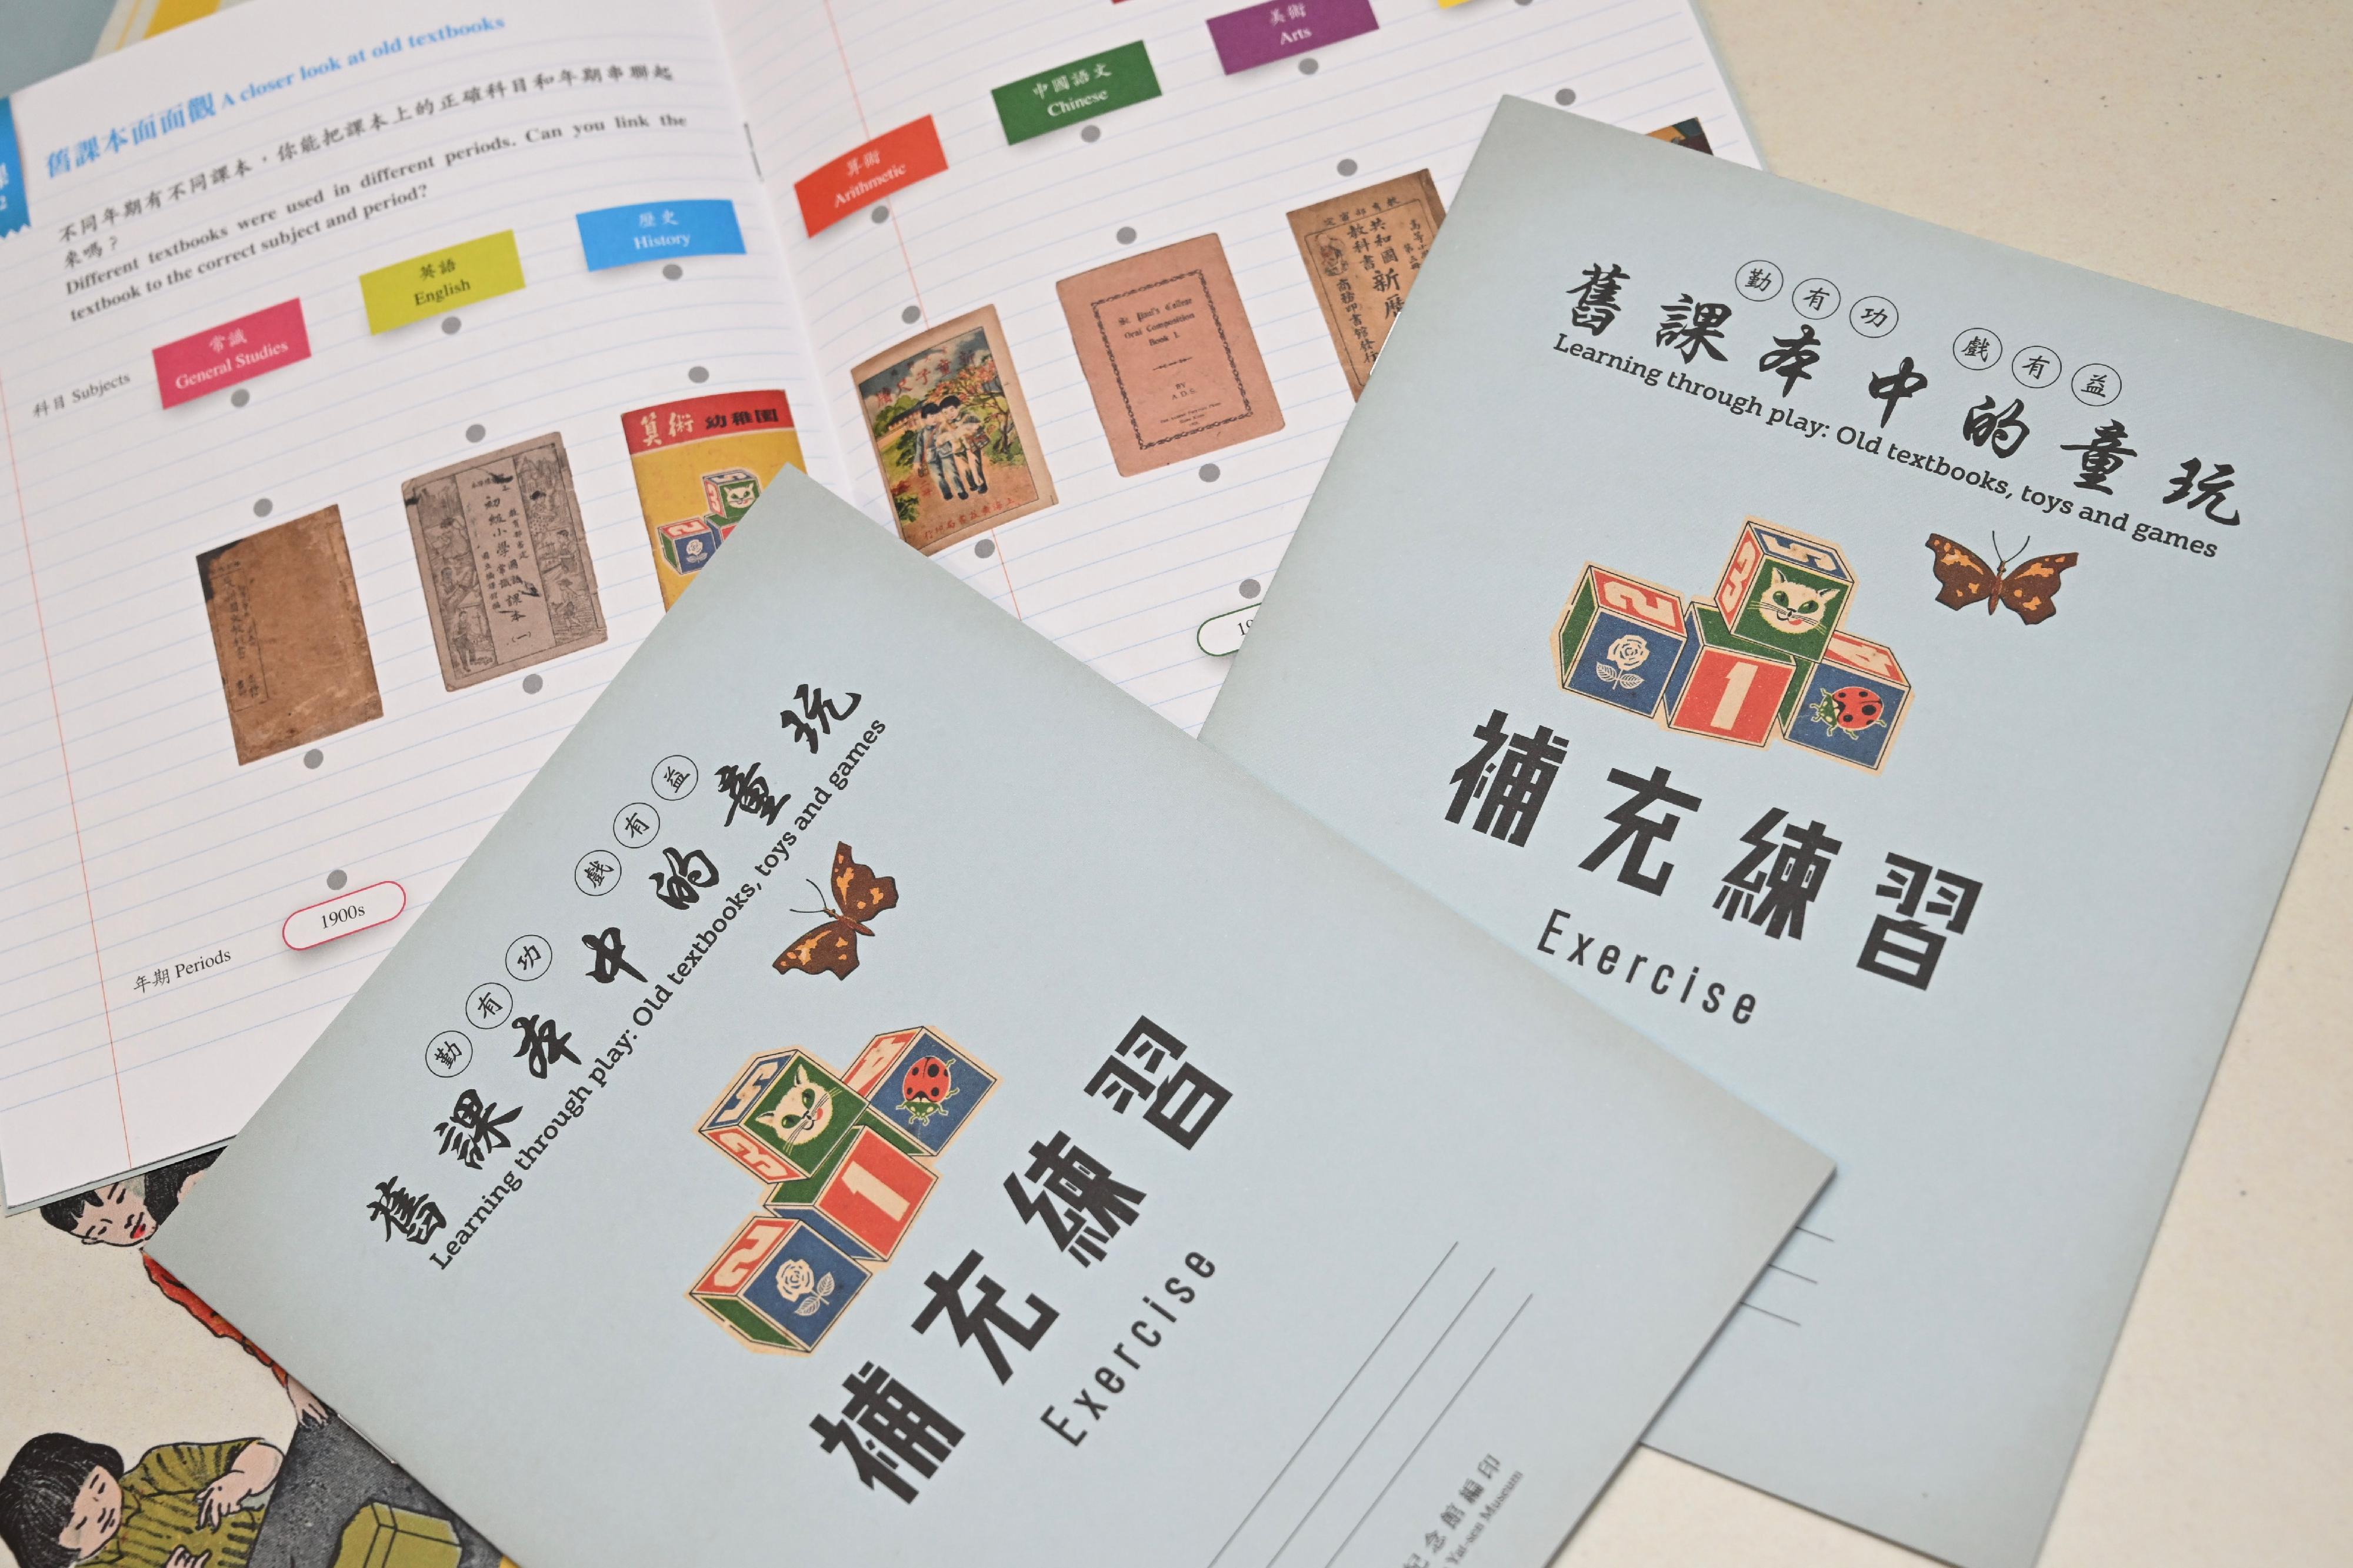
     The Dr Sun Yat-sen Museum will launch a new special exhibition, namely “Learning through play: Old textbooks, toys and games”, tomorrow (December 22). The exhibition makes use of multimedia with interactive elements and an immersive area to introduce the development of textbooks on the Mainland and in Hong Kong from the early to mid-20th century and explore the importance of children’s play in teaching.
      
     Before the middle of the 19th century, textbooks intended to provide enlightenment and books used to prepare for imperial examinations are two main types of teaching materials on the Mainland. Other common reading materials included biographies; poetry compilations; texts on the rhyme, rhythm and form of classical Chinese poetry; and books written specifically for the education of girls. The publication of new textbooks in modern China developed rapidly in the early 20th century. These textbooks were not only used in local primary and secondary schools, but also in overseas Chinese communities, especially in Southeast Asia. Games and toys are a perfect complement to textbooks, as they help inspire creativity and promote physical and mental development of children.
      
     This exhibition showcases more than 60 sets of Chinese textbooks, games and toys that were produced on the Mainland and in Hong Kong from the early to mid-20th century. Highlight exhibits include a Xunmeng Sanzijing (“Three character classic for early learners”) printed by Pak Lei Bookstore of Hong Kong in the 1930s, a Xin Tongzi Chidu (“New letter writing for children”) printed by Shanghai Guangyi Bookstore in 1932, a Shu-style Chinese typewriter from the early 20th century and shuttlecocks which were popular in the past.
      
     In addition to the precious exhibits, visitors can obtain more information about the games and toys in the early 20th century by scanning the QR codes in the gallery. They can also experience the environment of a rooftop primary school in the 1950s at the immersive area of the gallery.
      
     The exhibition will run from tomorrow (December 22) until March 31, 2024, at the Dr Sun Yat-sen Museum (7 Castle Road, Mid-Levels, Central, Hong Kong). For details of the exhibition, please visit hk.drsunyatsen.museum/en/web/sysm/exhibitions.html, or call 2367 6373 for enquiries.

Photo  Photo  Photo  Photo  Photo  Photo  Photo  Photo  
read more

Continued increase in Hong Kong’s gross expenditure on research and development in “Hong Kong Innovation Activities Statistics 2022”

     â€‹According to the report “Hong Kong Innovation Activities Statistics 2022” released today (December 21) by the Census and Statistics Department, the gross domestic expenditure on research and development (GERD) of Hong Kong in 2022 amounted to $30,138 million, representing an increase of 8 per cent compared with the corresponding figure in 2021. The GERD as a ratio to the Gross Domestic Product (GDP) increased to 1.07 per cent in 2022.

     A Government spokesman said, “The country indicates clear support in the National 14th Five-Year Plan for Hong Kong to develop into an international innovation and technology (I&T) centre. I&T has always been a top priority of the Government. In recent years, the Government has invested heavily in developing I&T infrastructure, promoting research and development (R&D), attracting and nurturing talent, supporting start-ups, etc. Moreover, since taking office, the current-term Government has launched a series of I&T measures to further enhance the I&T ecosystem in Hong Kong. It is encouraging to see that the GERD and the GERD as a ratio to the GDP have recorded satisfactory growth in 2022. We will continue to promote the I&T development in Hong Kong at full steam following the four broad development directions as set out in the Hong Kong Innovation and Technology Development Blueprint.”

     The spokesman also stated that a series of measures have been announced in the 2023 Policy Address, including pressing ahead with new industrialisation, facilitating the R&D of microelectronics and artificial intelligence development, fostering the synergistic development of the Hetao Shenzhen-Hong Kong Science and Technology Innovation Co-operation Zone, etc. In addition, the Research, Academic and Industry Sectors One-plus Scheme (RAISe+ Scheme) was launched in October this year to promote the “1 to N” transformation and commercialisation of R&D outcomes. The results of the first round of applications under the RAISe+ Scheme will be announced in the first quarter of 2024.

     “I&T is instrumental in societal progress and provides key impetus for Hong Kong’s high-quality economic development. The Government will strive to take forward various policy measures to realise the vision of developing Hong Kong into an international I&T centre,” the spokesman added. read more

Consumer Price Indices for November 2023

     The Census and Statistics Department (C&SD) released today (December 21) the Consumer Price Index (CPI) figures for November 2023. According to the Composite CPI, overall consumer prices rose by 2.6% in November 2023 over the same month a year earlier, slightly smaller than the corresponding increase (2.7%) in October 2023. Netting out the effects of all Government’s one-off relief measures, the year-on-year rate of increase in the Composite CPI (i.e. the underlying inflation rate) in November 2023 was 1.6%, also slightly smaller than that in October 2023 (1.7%).   

     On a seasonally adjusted basis, the average monthly rate of increase in the Composite CPI for the 3-month period ending November 2023 was 0.4%, and that for the 3-month period ending October 2023 was 0.5%. Netting out the effects of all Government’s one-off relief measures, the corresponding rates of increase were both 0.1%.    

     Analysed by sub-index, the year-on-year rates of increase in the CPI(A), CPI(B) and CPI(C) were 3.0%, 2.4% and 2.4% respectively in November 2023, as compared to 3.2%, 2.5% and 2.4% respectively in October 2023. Netting out the effects of all Government’s one-off relief measures, the year-on-year rates of increase in the CPI(A), CPI(B) and CPI(C) were 1.4%, 1.6% and 1.9% respectively in November 2023, as compared to 1.7%, 1.7% and 1.9% respectively in October 2023.    

     On a seasonally adjusted basis, for the 3-month period ending November 2023, the average monthly rates of increase in the CPI(A), CPI(B) and CPI(C) were 0.6%, 0.4% and 0.3% respectively. The corresponding rates of increase for the 3-month period ending October 2023 were 0.6%, 0.4% and 0.4% respectively. Netting out the effects of all Government’s one-off relief measures, the average monthly rates of increase in the seasonally adjusted CPI(A), CPI(B) and CPI(C) for the 3-month period ending November 2023 were 0.1%, 0.1% and 0.2% respectively, and the corresponding rates of increase for the 3-month period ending October 2023 were 0.1%, 0.2% and 0.2% respectively.    

     Amongst the various components of the Composite CPI, year-on-year increases in prices were recorded in November 2023 for alcoholic drinks and tobacco (18.9%), clothing and footwear (4.7%), meals out and takeaway food (3.7%), miscellaneous services (3.2%), housing (2.8%), miscellaneous goods (2.6%), transport (2.4%), and basic food (1.1%).    

     On the other hand, year-on-year decreases in the components of the Composite CPI were recorded in November 2023 for electricity, gas and water (-2.4%), and durable goods (-1.3%).    

     Taking the first 11 months of 2023 together, the Composite CPI rose by 2.1% over a year earlier. The respective increases in the CPI(A), CPI(B) and CPI(C) were 2.2%, 2.0% and 2.0% respectively. The corresponding increases after netting out the effects of all Government’s one-off relief measures were 1.7%, 1.8%, 1.6% and 1.8% respectively.    

     For the 3 months ending November 2023, the Composite CPI rose by 2.4% over a year earlier, while the CPI(A), CPI(B) and CPI(C) rose by 2.8%, 2.3% and 2.3% respectively. The corresponding increases after netting out the effects of all Government’s one-off relief measures were 1.7%, 1.7%, 1.6% and 1.9% respectively.    

     For the 12 months ending November 2023, the Composite CPI was on average 2.1% higher than that in the preceding 12-month period. The respective increases in the CPI(A), CPI(B) and CPI(C) were 2.2%, 2.0% and 2.0% respectively. The corresponding increases after netting out the effects of all Government’s one-off relief measures were 1.8%, 1.8%, 1.7% and 1.8% respectively.  

Commentary

     A Government spokesman said that the underlying consumer price inflation rate stayed moderate in November. Prices of meals out and takeaway food, and clothing and footwear continued to show visible increases over a year earlier. Price pressures on other major components remained broadly in check.  

     Looking ahead, overall inflation should remain moderate in the near term. External price pressures are expected to ease further. Domestic business cost might face some upward pressures as the economy continues to recover. The Government will continue to monitor the situation.  

Further information

     The CPIs and year-on-year rates of change at section level for November 2023 are shown in Table 1. The time series on the year-on-year rates of change in the CPIs before and after netting out the effects of all Government’s one-off relief measures are shown in Table 2. For discerning the latest trend in consumer prices, it is also useful to look at the changes in the seasonally adjusted CPIs. The time series on the average monthly rates of change during the latest 3 months for the seasonally adjusted CPIs are shown in Table 3. The rates of change in the original and the seasonally adjusted Composite CPI and the underlying inflation rate are presented graphically in Chart 1.

     More detailed statistics are given in the “Monthly Report on the Consumer Price Index”. Users can browse and download this publication at the website of the C&SD (www.censtatd.gov.hk/en/EIndexbySubject.html?pcode=B1060001&scode=270).

     For enquiries about the CPIs, please contact the Consumer Price Index Section of the C&SD (Tel: 3903 7374 or email: cpi@censtatd.gov.hk). read more

Hong Kong’s Balance of Payments and International Investment Position statistics for third quarter of 2023

     The Census and Statistics Department (C&SD) released today (December 21) the preliminary Balance of Payments (BoP) and International Investment Position (IIP) statistics of Hong Kong for the third quarter of 2023. This release also included the preliminary External Debt (ED) statistics of Hong Kong for the same period.

I.    Balance of Payments

     Hong Kong recorded a BoP surplus of $16.1 billion (2.1% of Gross Domestic Product (GDP)) in the third quarter of 2023. Reserve assets correspondingly increased by the same amount. This was against a BoP deficit of $90.5 billion (12.8% of GDP) in the second quarter of 2023.

Current account

     The current account recorded a surplus of $103.6 billion (13.5% of GDP) in the third quarter of 2023. This reflects that Hong Kong’s savings was greater than its investment, enabling Hong Kong to accumulate external financial assets (such as equity securities or debt securities) as a buffer against global financial volatilities. Compared with the current account surplus of $117.3 billion (16.3% of GDP) in the third quarter of 2022, the decrease in surplus was mainly due to the switch in goods balance from surplus to deficit and the decrease in services surplus, partly offset by the increase in net inflow of primary income.

     The goods account recorded a deficit of $23.8 billion in the third quarter of 2023, as against a surplus of $15.3 billion in the same quarter of 2022. Over the same period, the services surplus decreased from $41.9 billion to $38.2 billion. The primary income inflow and outflow amounted to $554.0 billion and $460.6 billion respectively, thus yielding a net inflow of $93.4 billion in the third quarter of 2023, compared with a net inflow of $64.0 billion in the same quarter of 2022.

Financial account

     An overall increase in financial non-reserve assets amounting to $127.4 billion (16.6% of GDP) was recorded in the third quarter of 2023, compared with an overall increase of $171.2 billion (24.2% of GDP) in the second quarter of 2023. The overall increase recorded in the third quarter of 2023 was due to the net increases in other investment and portfolio investment, partly offset by the net decreases in direct investment and financial derivatives.

     In the third quarter of 2023, reserve assets increased by $16.1 billion, as against a decrease of $90.5 billion in the second quarter of 2023.

II.   International Investment Position

     At the end of the third quarter of 2023, both Hong Kong’s external financial assets and liabilities stood at a very high level, amounting to $47,949.0 billion (16.4 times of GDP) and $34,624.5 billion (11.8 times of GDP) respectively, a typical feature of a prominent international financial centre.

     Hong Kong’s net external financial assets (i.e. assets minus liabilities) amounted to $13,324.6 billion (4.6 times of GDP) at the end of the third quarter of 2023, compared with $13,660.7 billion (4.7 times of GDP) at the end of the second quarter of 2023. Hong Kong’s net external financial assets to GDP ratio is one of the largest in the world, which provides the economy with a strong cushion against sudden external shocks.

III.  External Debt

     At the end of the third quarter of 2023, Hong Kong’s gross ED amounted to $14,402.4 billion (4.9 times of GDP). Compared with $14,042.0 billion (also 4.9 times of GDP) at the end of the second quarter of 2023, gross ED increased by $360.4 billion. This was mainly attributable to the increases in ED of the banking sector, ED of other sectors and debt liabilities in direct investment (intercompany lending).

     As one of the world’s major financial centres, Hong Kong has a significant amount of ED held against the local banking sector arising through normal banking businesses. At the end of the third quarter of 2023, 55.6% of Hong Kong’s ED was attributable to the banking sector. Other ED mainly consisted of ED of other sectors (26.5%) and debt liabilities in direct investment (intercompany lending) (17.0%).

Further information

     BoP is a statistical statement that systematically summarises, for a specific time period (typically a year or a quarter), the economic transactions of an economy with the rest of the world (i.e. between residents and non-residents).

     IIP is a balance sheet showing the stock of external financial assets and liabilities of an economy at a particular time point. The difference between the external financial assets and liabilities is the net IIP of the economy, which represents either its net claim on or net liability to the rest of the world.

     Gross ED, at a particular time point, is the outstanding amount of those actual current, and not contingent, liabilities that are owed to non-residents by residents of an economy and that require payment of principals and / or interests by the debtors at some time points in the future.

     Table 1 presents Hong Kong’s BoP. Table 2 presents the detailed current account and capital account, while Table 3 presents the detailed financial account. Table 4 shows Hong Kong’s IIP, and Table 5 shows Hong Kong’s ED.
 
     Statistics on BoP, IIP and ED for the third quarter of 2023 are preliminary figures, which are subject to revision upon the availability of more data. With the incorporation of the latest data from surveys and other sources, the statistics on BoP, IIP and ED for 2022 and the first and second quarters of 2023 have been revised.
 
     A new sign convention has been adopted for BoP statistics since June 2023. From then on: (i) debit entries in the current account and the capital account are switched from negative to positive figures; (ii) increases in assets and liabilities in the financial account are both indicated by positive figures; and (iii) the capital account and the financial account are no longer presented as a combined account. This sign convention complies with the international standards set out in the Sixth Edition of the Balance of Payments and International Investment Position Manual. It ensures consistency with national accounts and IIP statistics, and provides a simpler interpretation for BoP statistics.

     The latest statistical tables of BoP (including seasonally adjusted current account), IIP and ED can be downloaded at the website of the C&SD (www.censtatd.gov.hk/en/scode260.html). Analysis of the statistics, together with the conceptual and methodological details, are presented in the publication Balance of Payments, International Investment Position and External Debt Statistics of Hong Kong, Third Quarter 2023 published by the C&SD. Users can download the publication at the website of the C&SD (www.censtatd.gov.hk/en/EIndexbySubject.html?pcode=B1040001&scode=260).

     For enquiries about the BoP, IIP and ED statistics, please contact the Balance of Payments Section of the C&SD (Tel: 3903 6979 or email: bop@censtatd.gov.hk). read more