Speech by Benoît Cœuré, Member of the Executive Board of the ECB, at the workshop “Monetary policy in non-standard times”, Frankfurt am Main, 11 September 2017
Monetary policy has had a powerful impact on financial markets in recent years.[1] There is compelling international evidence that non-standard policy measures, such as asset purchases, forward guidance and negative interest rates, have been successful in altering relative asset prices in a way that is consistent with the predictions of portfolio rebalancing theory and the signalling channel of monetary policy.[2] Few therefore dispute that the first stage of transmission of non-standard policy measures to the financing conditions of the private sector has been effective. Since the effective lower bound on nominal interest rates is expected to prevail more often in the future, this is undoubtedly good news.
The situation is less clear, however, when it comes to the second and third stages of transmission – that is, from easier financial conditions to economic activity and from economic activity to prices. Many central bank observers point to continued anaemic growth and low inflation across the globe and conclude that unconventional policy measures have failed to stimulate the economy. If this were the case, it would place a question mark over the use of such measures.
In my remarks this morning I would like to examine this claim more closely. In doing so, I will focus on two prime channels underlying the second stage of transmission: the exchange rate channel and the real interest rate channel. My remarks will therefore be neither exhaustive nor complete, given that monetary policy can affect the economy through many other channels as well, such as its impact on the valuation of equities and, hence, on firms’ cost of capital and investment decisions, Tobin’s q in short.[3] Another channel of relevance is the bank lending channel as formalised by Bernanke and Gertler (1995).
But by focusing on the exchange rate and interest rate channels, we can get a good understanding of how effective recent policy measures have been. In particular, I will show that monetary policy-induced exchange rate movements may have considerable impact on consumer prices, but that this relationship depends on the state of the economy and the shocks driving it, much in line with the recent literature in this field. And I will show that the New Keynesian Investment and Savings (IS) curve is alive and well in the euro area – that is, aggregate demand responds to changes in real ex ante interest rates, and can also be shown to have done so in recent times, provided it is measured properly.
A state-dependent exchange rate pass-through
Let me start with the exchange rate channel – a channel that has been heavily debated in recent months in the light of the large movements that we have observed in the foreign exchange market. For example, since the beginning of April the euro has appreciated by around 13% against the US dollar and 7% in nominal effective terms. Textbook economics would suggest that such sizeable changes ought to lower the prices of imported goods and thereby put downward pressure on producer and consumer prices.
Slide 1
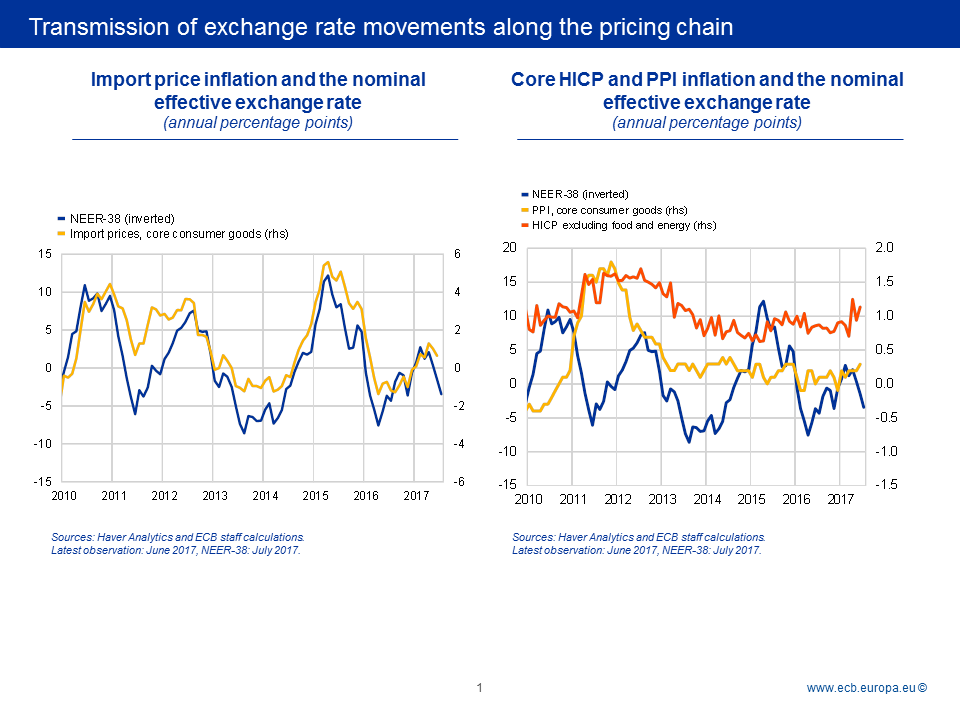 On the left-hand side of slide 1 you can see that there is indeed a strong correlation between annual changes in the euro’s nominal effective exchange rate and annual extra-euro area import price inflation, here shown for consumer goods excluding food, beverages and tobacco. Simple eyeballing would suggest a pass-through of around 40%, at least following depreciations, a point I will return to later. On the right-hand side you can see that the correlation is already much weaker in the case of the pass-through to producer and consumer prices. No discernible pattern emerges over the past seven years or so.
Of course, the reduced responsiveness at higher stages of the pricing chain in part reflects the fact that imports only account for a fraction of both producers’ overall input costs and final consumption. But the seemingly stubborn resilience of consumer and producer price inflation to the sharp depreciation of the euro in 2014, and the subsequent appreciation in 2015, is nevertheless surprising. After all, based on prevailing estimates in the literature, the net effect of these two opposing exchange rate movements could have lifted HICP excluding energy and unprocessed food inflation – I will refer to this as core inflation from now on – by up to 0.5 percentage point over the course of last year.[4] In other words, such estimates suggest that euro area core inflation in 2016 would have been less than half its actual level if it had not been for the euro’s depreciation in the preceding years.
While this cannot be ruled out in the absence of a reliable counterfactual, it at least invites suspicion, not least as producer price inflation proved equally resilient lately. Recent price developments therefore raise two important questions. First, has the exchange rate pass-through declined over time and, if so, is it a temporary or a more permanent phenomenon. And, second, if it has declined, is this related to the use of non-standard monetary policy measures?
My answer to the first question is that, yes, the pass-through is likely to have been lower in recent years, mainly for two reasons.
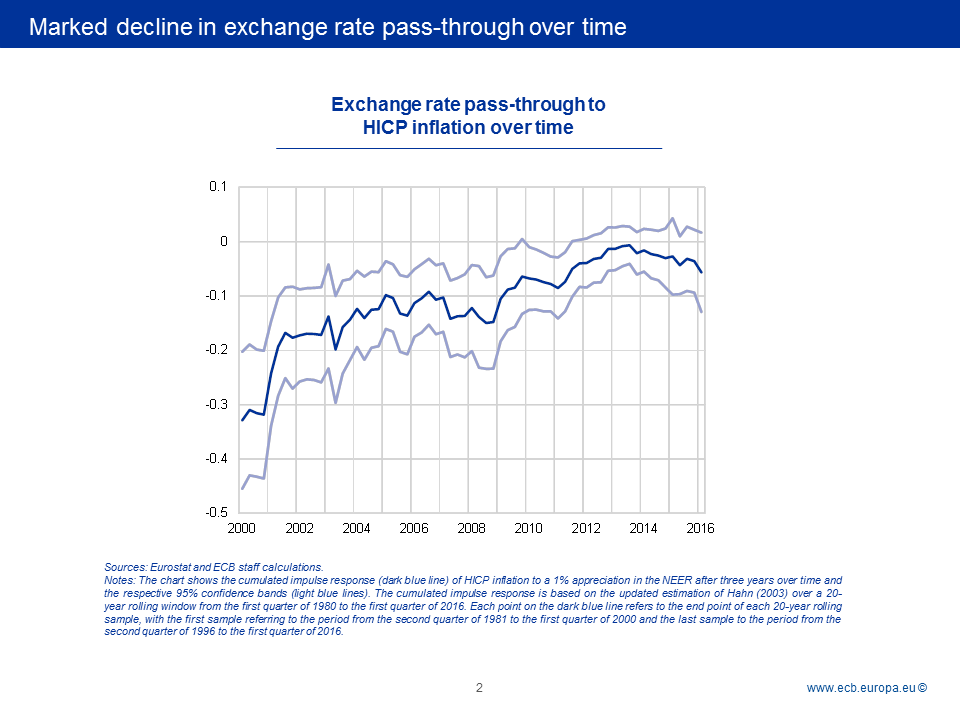
The first, and more permanent, reason has to do with structural factors unrelated to monetary policy. A large body of the literature illustrates that the exchange rate pass-through depends on factors such as the monetary policy framework, import composition, trade integration, currency invoicing and the rise of global value chains.[5] Broadly speaking, as globalisation has advanced and inflation and inflation volatility have declined, these factors have contributed to progressively reduce the exchange rate pass-through in most developed economies. For example, in the case of the euro area, it has been found that a growing share of local currency pricing has mechanically reduced the pass-through.[6] You can see this on slide 2 for the euro area. Today the pass-through to final consumer price inflation may be less than a third of what it was at the beginning of the century.
Slide 2
The second reason is more cyclical in nature. It relates to the state of the economy and the response of monetary policy to it. The theory is that exporters will not set their prices as a constant mark-up over costs, but will adjust them to expected changes in their future marginal costs and demand prospects. The implication is that what ultimately matters for the exchange rate pass-through is the type of shock that is hitting the economy. This notion goes back at least to Corsetti and Dedola (2005) but has received more prominence lately following the work of Kristin Forbes and co-authors (2015).[7]
Slide 3
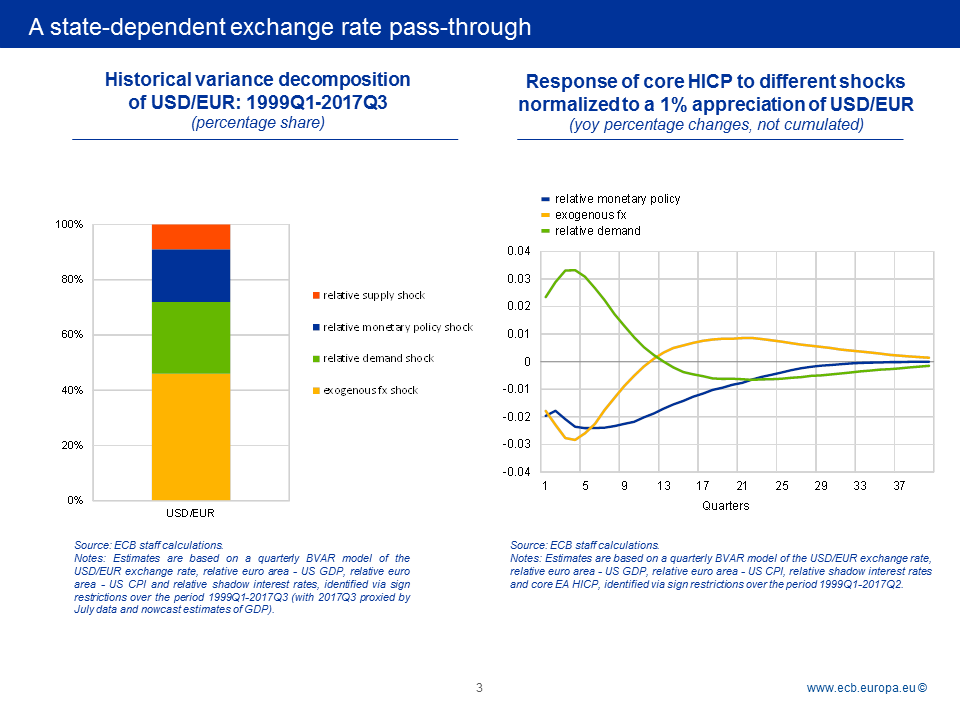
On the left-hand side of slide 3 you can see initial evidence to support this claim. ECB staff find that less than half of the euro’s exchange rate variations vis-à-vis the US dollar over the past almost 20 years was purely exogenous.[8] More often than not, exchange rates move in response to changes in relative demand, supply or monetary policy. And each of these shocks might entail a different response from domestic prices.
This you can see on the right-hand side. What this chart shows you is that there are occasions when euro area core inflation rises, rather than falls, following an exchange rate appreciation – which is entirely at odds with our traditional thinking on the pass-through. Perhaps unsurprisingly, this is typically the case when the exchange rate appreciates in response to a favourable demand shock. The logic is as follows: as the economy operates above capacity, inflationary pressures emerge that are sufficient to fully offset the disinflationary effects coming from the exchange rate channel.
The chart also shows that changes in the relative monetary policy stance have, on average, the expected impact on consumer prices: if euro area policy tightens, the exchange rate appreciates and inflation falls. In other words, there is no empirical evidence that the exchange rate channel of monetary policy is inactive.
But its strength will critically depend on the overall state of the economy, and not on the type of policy measure, standard or non-standard. This is my answer to the second question and can best be seen by looking at two concrete examples.
Slide 4
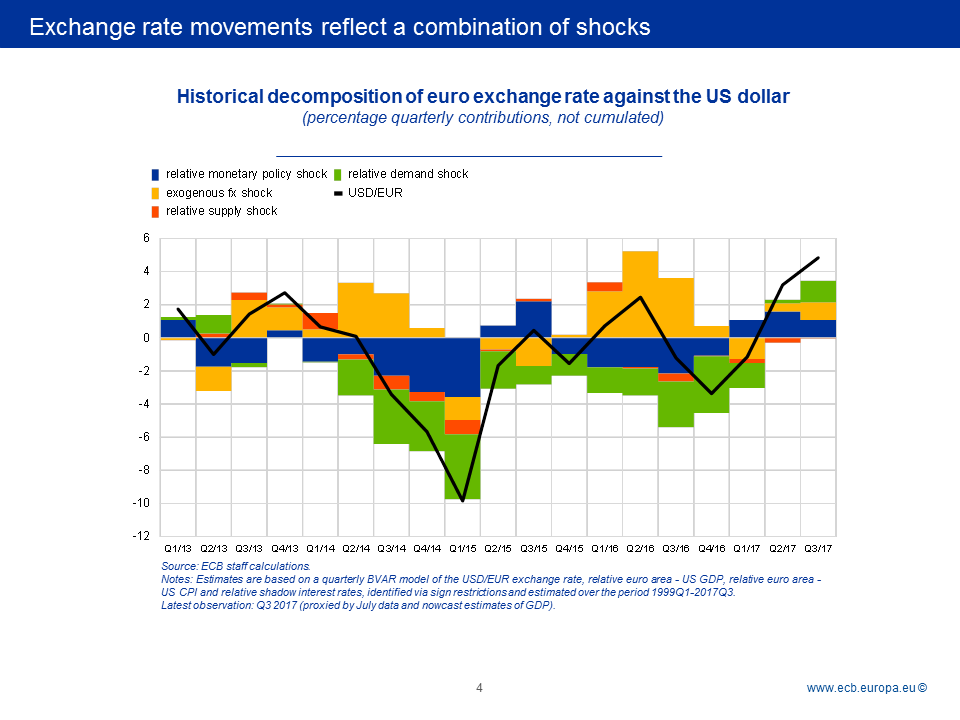 The first one relates to the sharp depreciation of the euro in the run-up to the announcement of the APP. As you can see on slide 4, a simple model-based analysis suggests that a large fraction of the decline in the euro’s external value reflected the worsening economic outlook, to which we ultimately reacted. It is likely that exporters to the euro area, faced with falling euro area demand, absorbed part of the exchange rate movement in their mark-ups to protect their market shares, thereby mitigating the upward pressure on prices stemming from a weaker currency.
The second example relates to the current situation. Slide 4 shows that there are three forces, of roughly equal strength, that help to explain the euro’s marked appreciation in recent months: improved euro area growth prospects, an exogenous component and a tightening in the relative monetary policy stance vis-à-vis the United States.
Slide 5
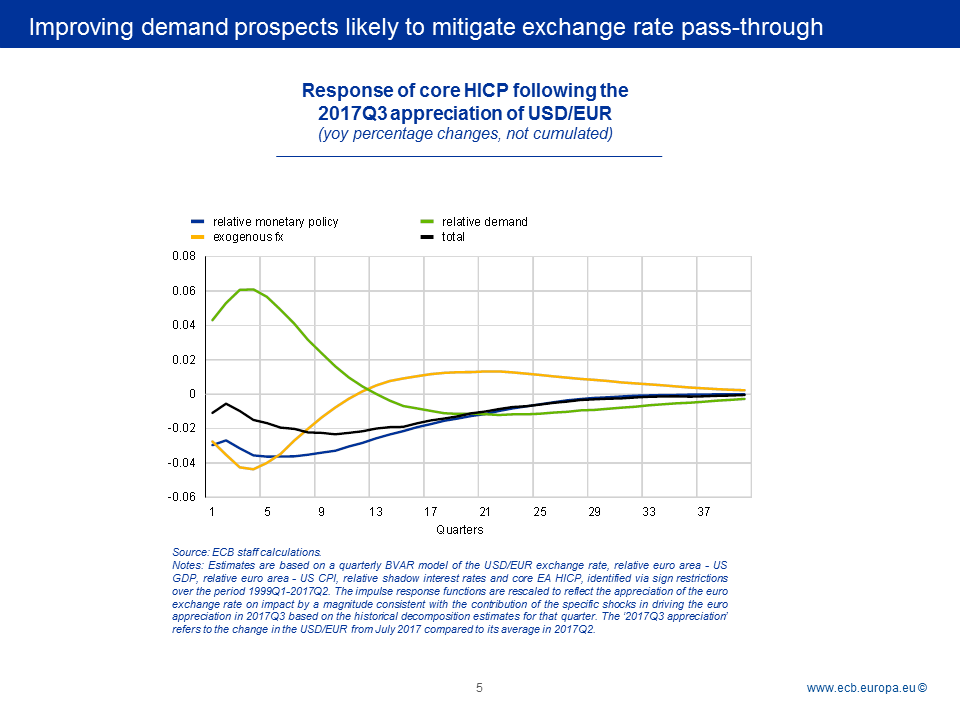
Slide 5 illustrates the implications of this shock decomposition for the assessment of the exchange rate pass-through. The black line, which is the net effect, suggests relatively mild downward pressure on core inflation, much below what the rule of thumb would tend to suggest, despite the sizeable appreciation.
The reason is simple. The current solid economic expansion in the euro area allows firms that export to the euro area to increase prices in their currency without losing market share, thereby mitigating, once again, the pass-through. So, exporters to the euro area are now able to recoup part of the margins they compressed during the downturn. The extent to which they are able to do so also depends on the degree of competition, a point made by Rudi Dornbusch back in 1987. The more concentrated market power is, and the less substitutable products are, the more likely firms are to increase their margins following exchange rate appreciations. This also means that the pass-through may well differ across industries.[9]
These examples demonstrate that it is by and large the state of the economy that will determine the strength of the pass-through. Monetary policy, for its part, is likely to influence the pass-through predominantly through its impact on the economy itself.
And at the moment this support from monetary policy may be even more powerful than in the past. The reason is that, in the class of models used here, positive demand shocks are normally identified by assuming that short-term interest rates rise in response to higher growth and inflation.
At the current juncture, however, the policy-relevant horizon – the “medium term” concept in our monetary policy strategy – is likely to be longer given the persistence of subdued inflationary pressures. Our forward guidance on both policy rates and the APP, as reiterated by the Governing Council last Thursday, reflects this assessment. This means that, compared with past demand shocks, policy will remain more accommodative for longer, thereby likely muting further the pass-through of any growth-driven exchange rate appreciation. And with the current recovery in the euro area being largely driven by domestic demand, euro strength may also have less of an impact on growth than, for example, after the Great Financial Crisis.
All of this suggests, therefore, that monetary policy never acts in isolation on the exchange rate and that, in periods of recovery, the positive confidence and stimulus effects of monetary policy are likely to offset, at least in part, the disinflationary effects of a stronger currency coming from expectations of tighter policy.
Slide 6
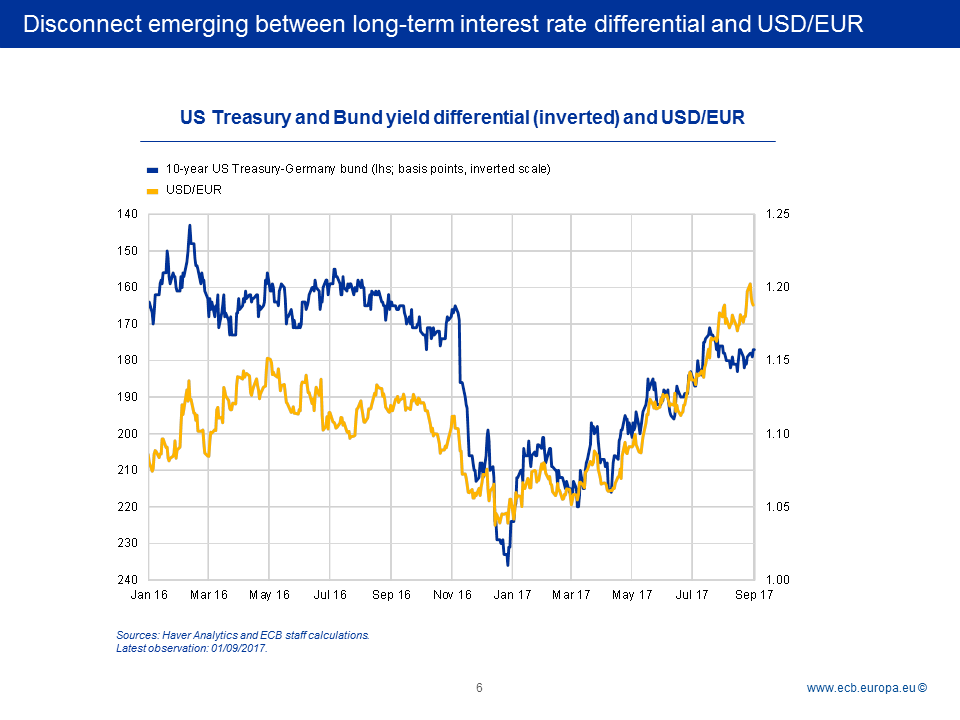
Of course, this also means that should the contributions of the different shocks driving the exchange rate change over time, then also our assessment of the impact on inflation will have to change – expansion or not. Exogenous shocks to the exchange rate, if persistent, can lead to an unwarranted tightening of financial conditions with undesirable consequences for the inflation outlook. As shown on slide 6, the emerging disconnect between the euro’s exchange rate vis-à-vis the US dollar and the long term interest rate differential between the US and Germany may suggest that we are entering such a situation. Against this background, the recent volatility in the exchange rate represents a source of uncertainty which requires monitoring.
The New Keynesian IS curve in the euro area
This brings me to the second channel I would like to discuss this morning: the effects of monetary policy on real economic activity.
Much of our attention recently has been focused on the properties of the Phillips curve – that it may be flatter, non-linear or mis-specified in terms of the relevant economic slack. By now, we are fairly confident that non-linearities and broader labour market slack are likely to explain much of the weakness in inflation as of late.[10]
Some observers have interpreted the lack of stronger price pressures as a failure of monetary policy to stimulate the economy. They argue that persistently low inflation is testimony to the ineffectiveness of non-standard policy measures. If this were true, then also the reasoning behind the shock-based exchange rate pass-through would in part be misguided.
I would argue, however, that such claims reflect a serious misunderstanding and simplification of how monetary policy works. There are very few instances, such as through the exchange rate, where policy can directly affect prices. In most cases monetary policy transmits to prices through its impact on the intertemporal allocation of consumption, savings and investment. If prices are slow to adjust, a cut in the key policy rate lowers the real interest rate, which, in turn, stimulates interest-sensitive spending. In other words, if we want to see if policy works or not, or if the economy has become less sensitive to changes in interest rates, then we should examine the slope of the IS curve, and not only of the Phillips curve.[11]
Empirical research on the IS curve is scarce, however. And the few studies available are generally not encouraging from a monetary policy perspective. They typically find that output does not respond, in a statistically significant way, to the real interest rate.[12] Often they even find a positive relationship between real interest rates and output. These findings are at best disturbing given that much of mainstream monetary thinking is built on the idea that firms and households take the level of the interest rate into account when making economic decisions.
Slide 7
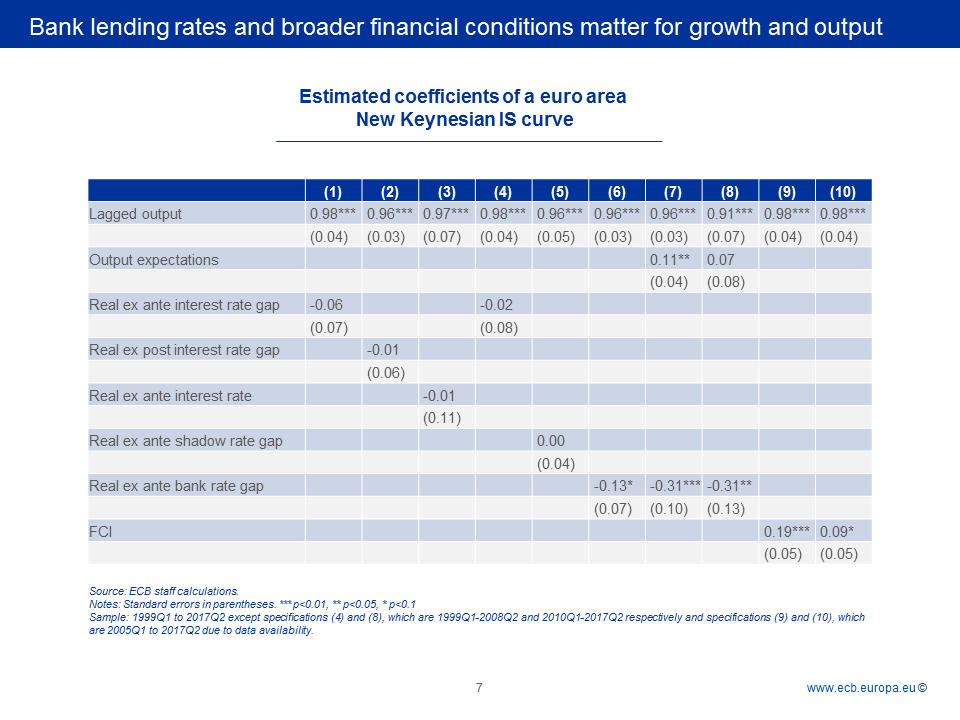
To illustrate the empirical failure of the IS curve, slide 7, column 1, shows the estimated coefficients of a regression of the euro area output gap on its own lag and a measure of the real “interest rate gap”, i.e. the difference between the real ex ante interest rate and the time-varying natural rate. Except for the fact that output is not forward-looking – I will come to this in a minute – this is a standard New Keynesian IS curve where the output gap is based on estimates by the European Commission, the short-term interest rate is the three-month Euribor, expected inflation is taken from the ECB’s Survey of Professional Forecasters (SPF) and the natural rate is taken from the euro area estimates by Holston, Laubach and Williams (2016).
Clearly, the real interest rate gap is not statistically significant at any reasonable confidence level. This finding holds true if we use actual ex post inflation – specification 2 – instead of expected inflation, or if we include the real interest rate per se, and not as a deviation from the natural rate, as is sometimes suggested, as in specification 3.
The financial crisis and the use of non-standard policy measures do not seem to explain the puzzle either: the real interest rate remains insignificant if we restrict the sample to the period before the outbreak of the crisis, specification 4, or if we take the euro area shadow rate as estimated by Wu and Xia (2016) – specification 5 – a measure that attempts to mimic the joint effects of unconventional policy measures at the zero-lower bound.
What I would argue, however, is that the short-term interest rate is not the appropriate measure to use in an empirical IS curve. In a bank-based economy, such as the euro area, the short-term interest rate may simply not be sufficient to characterise the monetary policy stance and, hence, the financial conditions ultimately determining the decisions by households and firms. The imperfect substitutability between market-based financing and bank loans was already recognised by Modigliani (1963) and later refined by Bernanke and Blinder (1988).
Indeed, it is enough to recall the period after the outbreak of the sovereign debt crisis, and the associated financial fragmentation, to see that the interbank market rate is a biased measure of the financing conditions facing the private sector.[13] In other words, unless there is a perfect transmission from changes in short-term rates to the ultimately relevant borrowing rates, estimates using the former will yield inconclusive results.
This conjecture is also supported by the data. In specification 6 we replaced the short-term interest rate with a measure of the composite bank-based cost of borrowing for non-financial firms. If we use this measure instead, the real ex ante interest gap in our IS curve has the expected sign and becomes statistically significant at the 10% level: a 1 percentage point reduction in the gap increases output by 0.13 percentage point.
The interest rate channel becomes even more powerful once we estimate a New Keynesian IS-curve that is closer to first principles – that is, one that is also forward-looking in output, as in specification 7. For this purpose, we add to the equation the expected real GDP growth rate six quarters ahead, as collected by the ECB’s SPF.
As in previous findings in the literature, output appears to be strongly forward-looking. But the thing to note is that the real interest rate gap is now significant at the 1% level, suggesting an increase in output by 0.3 percentage point following a 1 percentage point drop in the real rate gap. There is also no evidence that output might have become less sensitive to changes in real bank lending rates with the advent of non-standard measures: although the sample is naturally small, and estimates might therefore be biased, specification 8 illustrates that the coefficients remain unchanged when we estimate the same forward-looking IS curve for a sample starting with the outbreak of the sovereign debt crisis in 2010.
In other words, these estimates would suggest that about a quarter of the reduction in the output gap that we have observed since the introduction of our credit easing measures in June 2014 can be directly explained by the impact of our measures on bank lending rates, even after controlling for the indirect positive impact on expected inflation.[14] These estimates are very close to other internal ECB staff estimates, using more sophisticated term structure and general equilibrium models, of the impact of our measures on economic growth.[15]
So, monetary policy is far from being ineffective in stimulating aggregate demand, also when approaching the effective lower bound. The fact that inflation remains subdued rather reflects constraints operating at the third stage of transmission – from activity to prices – that are often outside the control of monetary policy.
Before I conclude I would like to illustrate one last point. Bank lending rates are without doubt a key variable in explaining output movements in the euro area. The evidence I provided today further emphasises this point. At the same time, the financial conditions that are ultimately relevant for firms and households may be broader than that. One of them – the exchange rate – I discussed in more detail earlier in my remarks.[16] Other factors may include equity prices or long-term interest rates that are often relevant for household mortgages.[17]
One way to summarise these factors is to use financial conditions indexes (FCIs). My colleague Peter Praet gave a detailed speech on such indices earlier this year, which I strongly recommend reading.[18] Here I would like to focus on the relevance of these broad measures for economic activity.
As you can see in column 9 of slide 7, FCIs are highly statistically significant when used in a New Keynesian IS curve. This is unlikely to be a statistical artefact. It is rather further evidence that we cannot reduce our analysis of the impact of monetary policy to a simple short-term rate as has typically been done in the academic literature so far.[19]
The question then is no longer which financial variable to use in estimations, but how to weigh them to reflect any varying impact they may have on output and, ultimately, inflation. For example, my last specification on slide 7 uses an FCI that attributes a much larger weight to the exchange rate, in line with the rule of thumb I mentioned earlier, which suggested a strong pass-through to inflation. Interestingly, this FCI fits the data less well, and is just about significant at the 10% level, which might support the view that the exchange rate pass-through could be lower than what such a rule of thumb would suggest.
But as I explained earlier, even a lower weight on the exchange rate would likely not fully capture the relative importance of the various financial variables at each point in time. That is, if the impact of changes in financial conditions on inflation depends on the state of the economy, then ideally FCIs would be based on time-varying weights. This is food for thought for future research.
Conclusion
With this in mind, let me conclude.
The negative relationship between the real interest rate gap and economic activity as posited by Wicksell back in 1898 is a mainstay of modern central banking. This relationship has not been lost with the advent of unconventional monetary policy measures. By easing market-based financial conditions, and by putting downward pressure on the real interest rate that banks charge to borrowers, central banks can stimulate aggregate demand, even when short-term interest rates approach the effective lower bound.
The validity of this relationship is also crucial for assessing the price effects of monetary policy-induced movements of the exchange rate. With policy being effective in boosting growth, any disinflationary effect of a stronger currency arising from expectations of a tighter future monetary policy stance might be mitigated, or offset, by the ensuing improvement in the economic outlook. However, exogenous shocks to the exchange rate, if persistent, can lead to an unwarranted tightening of financial conditions with undesirable consequences for the inflation outlook.
Thank you.
References
Ahmed, S., M. Appendino and M. Ruta (2015), “Global Value Chains and the Exchange Rate Elasticity of Exports”, IMF Working Paper WP/15/252.
Al-Eyd, A. and S. Pelin Berkmen (2013), “Fragmentation and Monetary Policy in the Euro Area”, IMF Working Paper No 13/208.
Altavilla, C., G. Carboni and R. Motto (2015), “Asset purchase programmes and financial markets: lessons from the euro area”, ECB Working Paper No 1864.
Andrade, P., J. Breckenfelder, F. De Fiore, P. Karadi and O. Tristani (2016), “The ECB’s asset purchase programme: an early assessment”, ECB Working Paper No 1956.
Ball, L., (1998), “Policy Rules for Open Economies”, NBER Working Paper No. 6760.
Bernanke, B. and A. S. Blinder (1988), “Credit, Money, and Aggregate Demand”, American Economic Review, Vol. 78, No 2, Papers and Proceedings of the One-Hundredth Annual Meeting of the American Economic Association, 435-439.
Bernanke, B. and M. Gertler (1995), “Inside the Black Box: The Credit Channel of Monetary Policy Transmission”, Journal of Economic Perspectives 9 (Fall), 27-48.
Blattner, T.S. and M. Joyce (2016), “Net debt supply shocks in the euro area and the implications for QE”, ECB Working Paper No 1957.
Blattner, T.S. and J. Swarbrick (2017), “Monetary policy and cross-border interbank market fragmentation: lessons from the crisis”, mimeo.
Campa, J.M. and L.S Goldberg (2008), “Pass-Through of Exchange Rates to Consumption Prices: What Has Changed and Why?”, in Ito, T. and Rose, A.K. (eds.), International Financial Issues in the Pacific Rim: Global Imbalances, Financial Liberalization, and Exchange Rate Policy, University of Chicago Press, Chicago, 2008, 139-176.
Cœuré, B. (2017), “Scars or scratches? Hysteresis in the euro area”, speech at the International Center for Monetary and Banking Studies, Geneva, 19 May.
Comunale, M. and D. Kunovac (2017), “Exchange rate pass-through in the euro area”, ECB Working Paper No 2003.
Corsetti, G. and L. Dedola (2005), “A macroeconomic model of international price discrimination”, Journal of International Economics, Vol. 67, Issue 1, 129-155.
Di Mauro, F., R. Rüffer, and I. Bunda (2008), “The changing role of the exchange rate in a globalised economy”, ECB Occasional Paper No 94.
Dornbusch, R. (1987), “Exchange Rates and Prices”, American Economic Review, Vol. 77, No 1, 93-106.
Draghi, M. (2015), “Global and domestic inflation”, speech at the Economic Club of New York, 4 December.
Draghi, M. (2017), “Accompanying the economic recovery”, speech at the ECB Forum on Central Banking, Sintra, 27 June.
Engel, C. and K. West (2010), “Global Interest Rates, Currency Returns, and the Real Value of the Dollar”, American Economic Review, 100(2), 562-67.
European Central Bank (2016), “Exchange rate pass-through into euro area inflation”, Economic Bulletin, July.
Forbes, K., I. Hjortsoe and T. Nenova (2015), “The shocks matter: improving our estimates of exchange rate pass-through”, Bank of England Discussion Paper, No 43.
Fuhrer, J. and G. Moore (1995), “Monetary Policy Trade-Offs and the Correlation Between Nominal Interest Rates and Real Output”, American Economic Review, 85, 219-239.
Fuhrer, J. and G. Rudebusch (2004), “Estimating the Euler equation for Output”, Journal of Monetary Economics, 21, 1133-1153.
Georgiadis, G., J. Graeb and M. Khalil (2017), “Global Value Chain Participation and Exchange Rate Pass-through”, mimeo.
Goodhart, C. and B. Hofmann (2005), “The IS Curve and the Transmission of Monetary Policy: Is there a Puzzle?”, Applied Economics, 37, 29-36.
Gopinath, G., O. Itskhoki and R. Rigobon (2010), “Currency Choice and Exchange Rate Pass-Through”, American Economic Review, Vol. 100, No 1, 304-336.
Gust, C., S. Leduc and R. Vigfusson (2010), “Trade integration, competition, and the decline in exchange-rate pass-through”, Journal of Monetary Economics, Vol. 57, Issue 3, 309-324.
Hahn, E. (2007), “The impact of exchange rate shocks on sectoral activity and prices in the euro area”, ECB Working Paper No 796.
Holston, K., T. Laubach and J. Williams (2016), “Measuring the Natural Rate of Interest: International Trends and Determinants”, Federal Reserve Bank of San Francisco Working Paper No. 2016-11.
Joyce, M., D. Miles, A. Scott, and D. Vayanos (2012), “Quantitative Easing and Unconventional Monetary Policy – an Introduction”, Economic Journal, 122(564), F271-82.
Landau, B. and F. Skudelny (2009), “Pass-through of external shocks along the pricing chain: A panel estimation approach for the euro area”, ECB Working paper No 1104.
Meltzer, A.H. (1999), “The Transmission Process”, Working Paper, Carnegie Mellon University.
Modigliani, F. (1963), “The Monetary Mechanism and Its Interaction with Real Phenomena”, Review of Economics and Statistics, 45(1), 79-107.
Modigliani, F. (1971), “Monetary Policy and Consumption”, in Consumer Spending and Monetary Policy: The Linkages. Boston: Federal Reserve Bank of Boston, 9-84.
Osbat, C. and M. Wagner (2006), “Sectoral exchange rate pass-through in the euro area”, ECB.
Praet, P. (2017), “Calibrating unconventional monetary policy”, speech at The ECB and Its Watchers XVIII Conference, 6 April.
Smets, F. and R. Wouters (2007), “Shocks and Frictions in US Business Cycles: A Bayesian DSGE Approach”, American Economic Review, Vol. 97, No 3, 586-606.
Stracca, L. (2017), “The Euler equation around the world”, The B.E. Journal of Macroeconomics, Vol. 17, Issue 2.
Svensson, L. (2000), “Open-Economy Inflation Targeting”, Journal of International Economics, 50, 155-183.
Taylor, J.B. (2000), “Low inflation, pass-through, and the pricing power of firms”, European Economic Review, Vol. 44, Issue 7, 1389-1408.
Williams, J. C. (2014), “Monetary Policy at the Zero Lower Bound: Putting Theory into Practice”, Working paper, Hutchins Center on Fiscal and Monetary Policy at Brookings.
Wu, J. C. and F. Xia (2016), “Measuring the Macroeconomic Impact of Monetary Policy at the Zero Lower Bound”, Journal of Money, Credit, and Banking, 48(2-3), 253-291.
 On the left-hand side of slide 1 you can see that there is indeed a strong correlation between annual changes in the euro’s nominal effective exchange rate and annual extra-euro area import price inflation, here shown for consumer goods excluding food, beverages and tobacco. Simple eyeballing would suggest a pass-through of around 40%, at least following depreciations, a point I will return to later. On the right-hand side you can see that the correlation is already much weaker in the case of the pass-through to producer and consumer prices. No discernible pattern emerges over the past seven years or so.

 The first one relates to the sharp depreciation of the euro in the run-up to the announcement of the APP. As you can see on slide 4, a simple model-based analysis suggests that a large fraction of the decline in the euro’s external value reflected the worsening economic outlook, to which we ultimately reacted. It is likely that exporters to the euro area, faced with falling euro area demand, absorbed part of the exchange rate movement in their mark-ups to protect their market shares, thereby mitigating the upward pressure on prices stemming from a weaker currency.

