I – Results of DESI 2018
What is the Digital Economy and Society Index?
The Digital Economy and Society Index (DESI) is a composite index published every year by the European Commission since 2014, measuring progress of EU countries towards a digital economy and society. It brings together a set of relevant indicators on Europe’s current digital policy mix.
The DESI is composed of five principal policy areas which regroup overall 34 indicators:
|
1 Connectivity |
Fixed broadband, mobile broadband, fast and ultrafast broadband and broadband prices |
|
2 Human capital |
Basic skills and internet use, advanced skills and development |
|
3 Use of internet service |
Citizens’ use of content, communication and online transactions |
|
4 Integration of digital technology |
Business digitisation and e-commerce |
|
5 Digital public services |
eGovernment and eHealth |
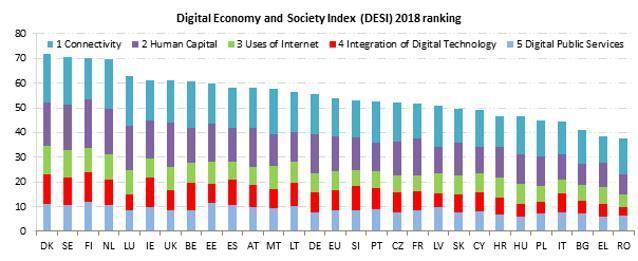
Here the results for 2018 DESI:

In 2017, all Member States improved in the DESI results. Denmark, Sweden, Finland, and the Netherlands have the most advanced digital economies, followed by Luxembourg, Ireland, the UK, Belgium and Estonia. Ireland, Cyprus and Spain progressed the most (by more than 15 points) over the last four years, while the lowest increase in digital performance was recorded in Greece (below 10 points).
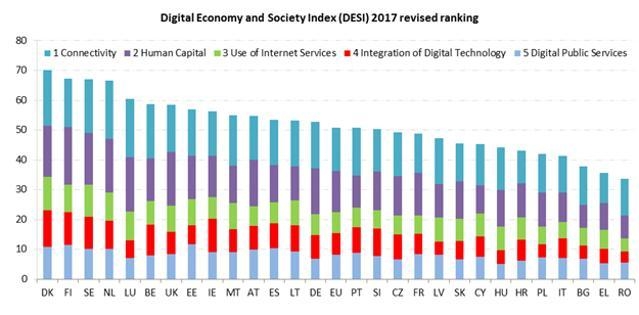
Here is the revised ranking for DESI 2017:

How do the Member States perform on the five dimensions of the index?

Regarding connectivity to broadband networks, the Netherlands, Luxembourg and Denmark show the highest overall connectivity levels.
Fixed broadband is available to 97% of Europeans, and 80% of European homes are covered by fast broadband (at least 30 Mbps). Ultrafast connectivity – measured for the first time by DESI (at least 100 Mbps) – is available to 58% of Europeans.
4G mobile networks cover on average 91% of the EU’s population, measured as the average of each mobile telecom operator’s coverage within each country.
75% of European homes subscribe to fixed broadband, and one third of all homes have at least 30 Mbps. The results also show that having an ultrafast broadband connection is increasingly more common. 15% of homes subscribe to ultrafast broadband, which is twice as high as two years ago.

Regarding the Human Capital dimension, 81% of Europeans go online regularly (at least once a week). This is 2 percentage points more than in the previous year. However, 43% of Europeans still do not have basic digital skills. Finland, the Netherlands and Sweden have the highest scores in this dimension.
The results show that the EU improved slightly in the number of Science, Technology, Engineering and Mathematics (STEM) graduates. While only 18.4 out of 1000 people between 20 and 29 years old graduated in STEM in 2013, this increased to 19.1 in 2015. Moreover, there were 8.2 million ICT specialists in the EU in 2016, growing from 7.3 million 3 years earlier.

The percentage of internet users engaging in various online activities has overall slightly increased in comparison to the DESI 2017 results. 72% of internet users read news online, 46% make video or audio calls, 65%, use social networks, 68% shop online and 61% use online banking.

As for the Integration of technology, European businesses are increasingly adopting digital technologies. This includes the use of a business software for electronic information sharing (from 26% in 2013 to 34% of enterprises in 2017), sending electronic invoices (from 10% in 2013 to 18% of enterprises in 2016) or using social media to engage with customers and partners (from 15% in 2013 to 21% of enterprises in 2017). This trend is most advanced in Denmark, Finland and Ireland.
eCommerce by SMEs also grew slightly (from 14% in 2013 to 17% of SMEs in 2017). Nevertheless, less than a half of those trade online sell to another EU Member State while the majority operates only within their country.

The Digital Public Services dimension measures the digitisation of public services, focusing on eGovernment and eHealth. Modernisation and digitisation of public services can lead to efficiency gains for the public administration, citizens and businesses. The European champions in Digital Public Services are Finland, Estonia and Denmark.
How does the EU compare to other digitised countries worldwide?
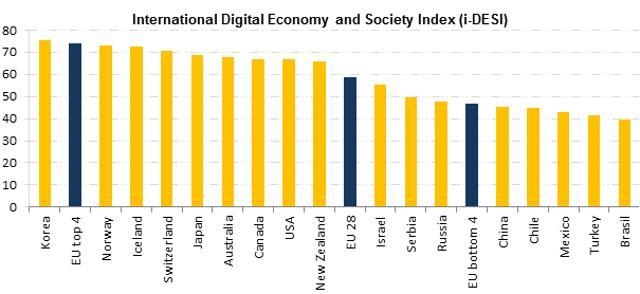
The Commission also compare the digital performance of EU countries with 17 non-EU countries. The International DESI (I-DESI) evaluates the performance of both the individual EU countries and the EU as a whole in comparison to Australia, Brazil, Canada, Chile, China, Iceland, Israel, Japan, South Korea, Mexico, New Zealand, Norway, Russia, Serbia, Switzerland, Turkey and the United States. This is the second time the Commission compares the DESI with international data.

The results of the forthcoming study show that the top four EU countries (Denmark, Finland, Sweden and the Netherlands) are among the global leaders. They are just behind Korea and have higher scores than the United States and Japan. At the same time, however, the comparison shows that the EU’s average in digital performance is significantly lower. The full iDESI report will be available in June.
I-DESI includes the same five dimensions as the DESI, but it is built on a slightly different set of indicators than DESI due to some DESI indicators not being available in non-EU countries. As a result, the I-DESI rankings and scores are slightly different to those of the DESI.
II – DESI methodology
Where does the data come from?
The majority of DESI indicators come from the surveys of Eurostat, the statistical office of the European Union. Some broadband indicators are collected by the Commission services from the Member States through the Communications Committee. Other indicators are derived from studies prepared for the Commission (e.g. some eGovernment and broadband indicators). See the full list of indicators, exact definitions and sources.
How is the DESI score calculated?
To calculate a country’s overall score, each set and subset of indicators were given a specific weighting by European Commission experts. Connectivity and digital skills (‘human capital’), each contribute 25% to the total score. Integration of digital technology accounts for 20%, since the use of ICT by the business sector is one of the most important drivers of growth. Finally, online activities (‘use of internet’) and digital public services each contribute 15%. For more details, see the DESI methodological note.
How are EU countries clustered?
Three clusters were created based on the DESI score.
- High performing countries are the 9 EU Member States with the highest DESI score. These are Denmark, Sweden, Finland, the Netherlands, Luxembourg, Ireland, the UK, Belgium and Estonia.
- Medium performing countries have close to average DESI scores. These are Spain, Austria, Malta, Lithuania, Germany, Slovenia, Portugal, the Czech Republic, France and Latvia.
- Low performing countries are the 9 Member States at the bottom of the list. These are Slovakia, Cyprus, Croatia, Hungary, Poland, Italy, Bulgaria, Greece and Romania.
What has changed in the DESI compared to 2017?
To improve the methodology and take into account the latest technological developments, a limited number of changes were made in DESI 2017:
Connectivity
- The Ultrafast Broadband sub-dimension was added measuring Ultrafast Broadband coverage (the combined footprint of Fibre to the Premises and Cable Docsis 3.0., measured as the percentage of homes) and Ultrafast Broadband Take-up (percentage of homes subscribing to at least 100 Mbps). Fast Broadband Take-up is measured as the percentage of homes in DESI 2018 instead of the percentage of subscriptions used in earlier publications. Spectrum was removed from the index.
- Broadband prices: A more robust methodology was used for the calculation of fixed broadband prices, assessing 12 consumption baskets and household income
Human capital
- STEM graduates: the historical data were revised by Eurostat
The Use of Internet Services and the Integration of Digital Technology dimensions were not affected by any change.
Digital Public Services
- eHealth was re-introduced as a sub-dimension with one indicator measuring the percentage of people who used health and care services provided online. Under eGovernment a new indicator was added on digital public services for businesses.
In addition, a limited number of historical data points were revised for other indicators, too. As a result of the above changes, the rankings for the previous years have slightly changed.
How did the improved methodology affect the ranking of last year?
As a result of the improved methodology, the rankings for the previous years have slightly changed.
For more information
Factsheet: Digital Single Market for benefits of all Europeans
Factsheet: Data Economy for all Europeans
Creating a Digital Single Market – European Commission action since 2015
Follow this news feed: EU


