Speech by Peter Praet, Member of the Executive Board of the ECB,
at The ECB and Its Watchers XVIII Conference organised by the Center for Financial Studies at Goethe University Frankfurt, panel on the “Assessment of the expanded asset purchase programme” (with John Taylor and Jan Hatzius),
Frankfurt am Main, 6 April 2017
The ECB’s monetary policy stance is currently driven by three main mutually reinforcing instruments: a negative deposit facility rate; an expanded asset purchase programme covering a broad range of private and public securities (APP); and an integrated system of forward guidance that governs the future path of asset purchases and short-term interest rates, as well as the sequencing of these different policy tools. Moreover, the targeted longer-term refinancing operations, the last of which was conducted in March, will continue to incentivise bank lending over the next four years.[1]
These measures have supported financial conditions, which – due to their prominent role in the transmission of policy impulses – act as a crucial intermediate variable in the pursuit of a stability-oriented monetary policy. However, while the role of financial conditions in the transmission process has remained as relevant as ever, the task of steering them in line with domestic macroeconomic policy objectives has become more challenging in view of the manifold dislocations in financial markets that have arisen since the crisis and the proximity of standard policy instruments to their lower bound. The ECB’s unconventional measures have confronted these challenges and ensured an appropriate degree of accommodation by fostering very favourable financing conditions.
Our monetary policy is working, and we see that, supported by our mutually reinforcing monetary policy measures, the euro area economic recovery is steadily firming. The cyclical recovery is gaining momentum and the expansion is broadening across sectors and countries, showing the effectiveness of the transmission of our measures throughout the entire euro area economy. Yet, the risks to the growth outlook remain tilted to the downside, even though their balance is improving. And, importantly, inflation dynamics continue to be conditional on the present, very substantial degree of monetary accommodation.
In calibrating the set of monetary policy instruments, we faced – and we still face – two issues.
The first, which I will refer to as the measurement issue, consists in quantifying the overall amount of monetary policy support that we are providing and parsing that support down to the individual instruments. In unconventional monetary policy times, measuring the contribution of each instrument to the stance is crucial to ensuring an appropriate composition of the policy toolkit – a challenge that is much less pronounced in conventional times when the decision space focuses on policy-controlled short-term interest rates as the one, dominant, tool to steer the stance. Measuring the marginal contributions of each instrument is very hard however.
The second issue, which I will refer to as the benchmarking issue, consists in determining whether the resultant, overall monetary policy support is appropriate, i.e. commensurate with our assessment of the state and expected evolution of the economy; and, if any changes are necessary, what specific instrument in our multi-pronged policy strategy needs to be adjusted.
In today’s speech, I will review these different challenges and describe the ECB’s approach to addressing them.
Measuring and benchmarking monetary policy
To operationalise the intended policy path, it is crucial to form an assessment of the prevailing stance.
Here, economists have traditionally resorted to two types of indicators. One consists of policy rules that exploit the systematic relationship between a monetary-policy controlled short-term interest rate, in deviation from some medium-term equilibrium value, and a set of macroeconomic variables, typically including inflation and economic slack – as in the eponymous Taylor rule. Given an assumption for the medium-term equilibrium interest rate norm, these rules promise to deliver a level of the short-term rate that would be consistent with driving the economy back to a sustainable non-inflationary path starting from current macroeconomic conditions.
The other type of indicator consists of Financial Conditions Indexes (FCIs) that synthesise potentially large numbers of financial variables and weight them based on how well they forecast future (nominal or real) economic activity or how much of the common variation of the individual constituent variables they explain – a field to which Jan Hatzius has made important contributions.[2]
The simple benchmarking flavour of the Taylor rule and the broad, encompassing metric of accommodation offered by the FCIs represent a valuable disciplining tool from which one can start to reflect about the prevailing stance and the way the stance should be adjusted as new information flows in.
FCIs, in particular, can facilitate story-telling. They have also been able to broadly track the most salient, yet not all, phases of the recent crisis.[3] Overall, they show a positive trend in financial conditions since 2009, reflecting the policy response to the crisis. This was preceded however by a tightening in financial conditions in 2007 and 2008 on the back of investor panic and contagion effects that spilled over across the entire array of asset prices at the height of the crisis. The FCIs also show the subsequent reabsorption that took place in the aftermath of the forceful response by central banks and other policy actors around the globe (see their evolution in the span of time marked by the shaded area for the “global financial crisis”). Furthermore, they document the renewed tightening in euro area financing conditions that was heralded by the escalation of the sovereign debt crisis in the spring of 2010. More recently, the FCIs point to a clear footprint of the non-standard monetary policy measures the ECB adopted since mid-2014, after the rate cuts over the preceding two years had coincided with broadly unchanged financial conditions.[4] Yet their improvement from end-2011 onward stands in contradiction with the escalation of the sovereign debt crisis, a point I come back to shortly.
Chart 1: Financial Conditions Indexes for the euro area (standard deviations)
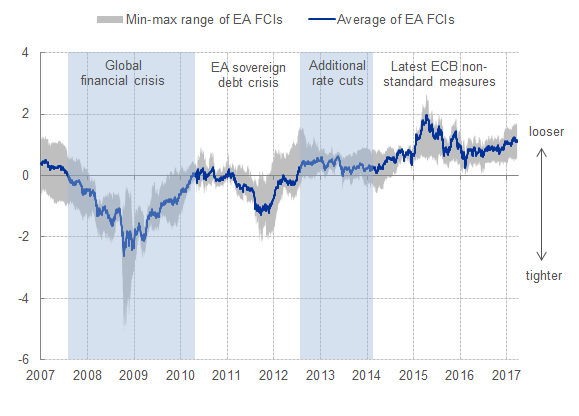
Sources: ECB, Bloomberg, Goldman Sachs.
Note: the chart presents two FCIs constructed by the ECB; one by Bloomberg and one by Goldman Sachs (GS). The FCIs are constructed as weighted averages of different financial variables. For the ECB FCIs these variables include the 1-year OIS, the 10-year OIS, the NEER of the euro vis-à-vis 38 trading partners, and the Euro Stoxx Index. For the Bloomberg and Goldman Sachs FCIs, broader sets of variables are considered (see footnote 3). The weight of each financial variable in the ECB and GS indexes is based on their estimated relationship to key macroeconomic aggregates. The variables in the Bloomberg FCI are subdivided into sub-indexes, consisting of money-market, bond-, and equity-indicators, and equally weighted within and across indexes. Latest observation: 31 March 2017.
Both approaches, FCIs and policy-rules, encounter challenges regarding both the inference that they suggest concerning the quantum of monetary policy accommodation prevailing at any specific point in time (their measurement function) and the prescriptive value that one can extract for calibrating current and future policies (their benchmarking function). I believe one can say that their dual informative value is degraded particularly in the wake of major dislocations – in financial markets and in the functioning of the economy more broadly – of the sort we had to confront in the recent past.
Financial conditions indexes
Let me make this point specifically with regard to FCIs and, for that purpose, let me comment on Chart 1. I concentrate on the period prior to July 2012, when Mario Draghi gave in London a speech which is widely credited for stemming the panic that had been raging for a whole year in the euro area financial markets. The panic – by any measure – had already impaired firms’ and households’ access to credit in broad regions of the currency union to an extent that was damaging macroeconomic stability in systemic proportions. And it had induced a pronounced impairment in monetary policy transmission. This was visible for instance from bank lending rates which, despite a series of cuts in monetary-policy controlled short-term interest rates, remained stubbornly high and only started entering a pronounced and durable downward convergence path around the time in which the ECB adopted its credit easing measures in mid-2014 (see Chart 2).
Chart 2: EONIA, key ECB interest rates, and euro area bank lending rates on loans to NFCs (percentages per annum)
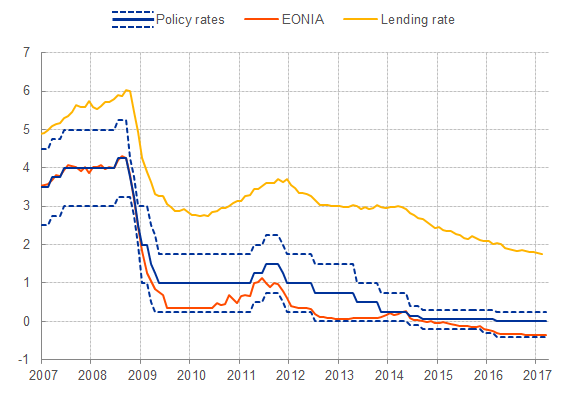
Sources: ECB, ECB staff calculations.
Notes: Bank lending rate is calculated as the total cost of borrowing by aggregating short- and long-term rates using a 24-month moving average of new business volumes. The policy rates (ordered from highest to lowest) consist of the rate on the marginal lending facility (MLF), the rate on the main refinancing operations (MRO), and the rate on the deposit facility (DFR). Latest observation: March 2017 for the policy rates and EONIA, February 2017 for the bank lending rates.
But, while this sequence of events and causative influences is well-documented empirically, the picture that emerges from the FCIs is somewhat different. According to the indicators shown in Chart 1, conditions seem to have been loosening – not tightening – in the 6 months prior to the time of the speech. While conditions eased further, more or less in correspondence of the event in July 2012, that further shift in the range of financial condition indices is marginal if contrasted with its upward trend that had occurred before.
How can this be explained? The explanation mainly resides in the large weight that these indicators tend to assign to the exchange rate for averaging across financial market variables. The dramatic bout of risk aversion and pessimism about the sustainability of the euro area, which pre-dated the speech, had encouraged a massive reallocation of international portfolios away from euro area assets, and this capital flight had led to a material depreciation of our currency. Was this depreciation a net source of accommodation in the months preceding the July speech? Or wasn’t it rather the reflection of an underlying and pervasive re-appraisal of break-up risk which would restrain consumption and business investment for years to come and remain a lingering factor weighing down on the recovery to this day? I tend to conclude in favour of the latter interpretation, which also shows that careful judgement needs to be exercised when interpreting FCIs, particularly at times of dramatic financial disruption.
We can generalise this message beyond episodes of heightened financial stress. By weighting different variables – such as the exchange rate, equities and interest rates – by their estimated impact on important macroeconomic aggregates, FCIs promise to offer a way to identify an “equivalence scale”, on the basis of which one can weigh the importance of one financial variable against the importance of another in maintaining a certain degree of looseness/tightness. But we should be wary of over-stretching this notion to mechanical prescriptive implications, because this can inspire unwise policy conclusions. A given level of the FCI can be delivered by many different combinations of drivers and underlying forces, which make the mapping between that particular level and the broad stance of policy an elusive task.
Let me make another example that is valid in abnormal and more tranquil times alike. An increase in long term rates can be a purely exogenous rate shock, if they merely reflect the tendency of domestic yields to fluctuate in synch with international yields; or it can reflect more optimistic expectations concerning the state of the domestic economy. The stance implications of these two scenarios are vastly different.
An interesting case study emerges from the global shifts in financial market sentiment since autumn 2016. An attempt to disentangle different drivers of key financial market variables exploiting cross-asset correlations (see Chart 3) shows that global factors may have been exerting strong influence on euro area financing conditions, with tightening pressures on real interest rates (see left panel). At the same time, part of the increase in real rates over this period would be reflecting the ongoing improvement in euro area macroeconomic conditions, which also supported equities (see right panel). And the upward impacts on real interest rates would have been offset by domestic monetary policy, thus partly insulating euro area financing conditions from the tightening pressures originating from abroad. The relevance of different drivers entails an important caveat against a mechanical interpretation of changes in FCIs.
Chart 3: Drivers of euro area long-term real interest rates and equities (contributions in p.p.)

Source: ECB staff calculations based on Matheson and Stavrev (2014).
Notes: Shocks are identified by applying sign restrictions in an estimated vector auto regression (VAR) model of real long term bond yields, stock prices, the euro nominal effective exchange rate, and inflation expectations. It is assumed that positive “policy” shocks push up real yields, reduce stock prices, appreciate the domestic currency, and reduce inflation expectations. Positive domestic macro shocks push up the four variables. Foreign shocks move yields in the opposite direction of the exchange rate. Last observation: 28 March 2017.
This is not the only caveat however. Of course, timeliness is a practical advantage of these types of FCIs, which are based on high-frequency financial market information that can be tracked on a daily basis. In the euro area, however, this timeliness may conflict with the relevance of measuring broader financing conditions that account for the availability and pricing of bank lending. Given the bank-based financing structure of the euro area, such indicators are essential to assessing the transmission of monetary policy. But they are only available at a significantly lower frequency and – even in normal conditions – the transmission of policy impulses to bank lending conditions is more sluggish than to the financial market variables typically included in FCIs, such as equity indexes or exchange rates. This is why FCIs can only provide a partial picture of prevailing financing conditions that needs to be complemented with further sources, including inter alia an in-depth analysis of monetary and credit developments as embedded in the second pillar of the ECB monetary policy strategy.
Another caveat derives from the considerable uncertainty surrounding the appropriate weighting of individual constituent variables. Conceptually, it appears attractive to base such weighting on the impact that exogenous variation in each of these variables would exert on relevant economic aggregates, such as growth or inflation. Practically, however, such impact estimates are wrought with a host of complex identification issues.
Finally, when using FCIs to track the evolution of financing conditions as an intermediate target, policy-makers have to be mindful of differences in the controllability of its individual components. In normal conditions, when monetary policy uses short-term interest rates as its dominant policy tool and builds on a broadly predictable connection between these rates and broader financing conditions, it is relatively straightforward to steer and assess its intermediate target. However, in crisis times – when the link between short-term interest rates and broader financing conditions is weakened and monetary policy increasingly relies on more direct means to affect a broader range of financial variables – it becomes significantly more complex to assess the impacts of the various monetary policy measures.
More granular model-based evidence suggests that the ECB’s non-standard monetary policy measures have left a clear footprint in euro area financing conditions. In particular, they have induced a broad-based easing that spread across a variety of asset classes, including to bank lending rates (Chart 4). As a consequence, notwithstanding the pronounced influences from abroad, the ECB has been successful in managing domestic financing conditions through its monetary policy measures.
Moreover, the impact of these more recent measures has been further supported by the effectiveness of our forward guidance. One potential metric for this effectiveness is the sensitivity of forward rates to macroeconomic news: in the presence of clear guidance on the policy rate path, market expectations should be less reactive to the ongoing macroeconomic news flow and instead be anchored by central bank communication. Observing this metric over time, it becomes clear that the introduction of our measures – including the forward guidance on policy rates – has been followed by a pronounced decline in the sensitivity of forward rates at the shorter end of the term structure, which is most prominently driven by monetary policy expectations, while remaining anchored around their historical average at the longer end (Chart 5).
Chart 4: Impact of ECB measures on key financing conditions (contributions in basis points and percent)
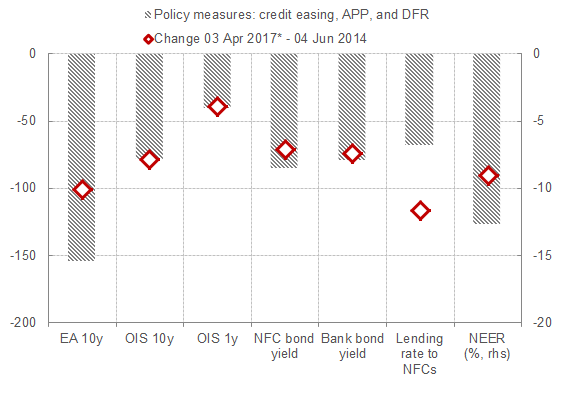
Sources: Bloomberg, ECB, ECB calculations.
Notes: The impact of credit easing is estimated on the basis of an event-study methodology, which focuses on the announcement effects of the June-September 2014 package; see the EB article “The transmission of the ECB’s recent non-standard monetary policy measures” (Issue 7 / 2015). The impact of the DFR cut rests on the announcement effects of the September 2014 DFR cut. APP encompasses the effects of January 2015, December 2015, March 2016, and December 2016 measures. The January 2015 APP impact is estimated on the basis of two event-studies exercises by considering a broad set of events that, starting from September 2014, have affected market expectations about the programme; see Altavilla, Carboni, and Motto (2015) “Asset purchase programmes and financial markets: lessons from the euro area” ECB WP No 1864, and De Santis (2015), “Impact of the asset purchase programme on euro area government bond yields using market news”, ECB WP No. 1939. The quantification of the impact of the December 2015 policy package on asset prices rests on a broad-based assessment comprising event studies and model-based counterfactual exercises. The impact of the March 2016 measures and the impact of the December 2016 measures are assessed via model-based counterfactual exercises. *Changes in lending rates are based on monthly data, the reference period for which is June 2014 to February 2017.
Latest observation: 03 April 2017.
Chart 5: Time varying sensitivity of the 3-month OIS in 2-years’ (LHS) and 10-years’ (RHS) time (normalized to 1)
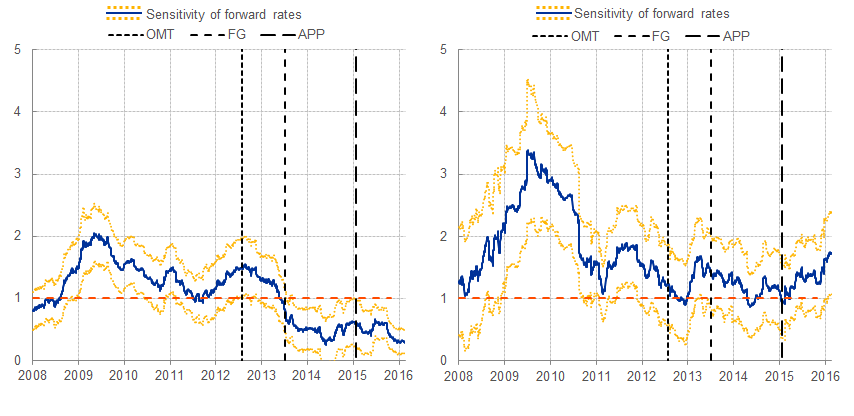
Source: ECB. Estimation is based on Altavilla C., Giannone D. and Modugno M. 2014. “The Low Frequency Effects of Macroeconomic News on Government Bond Yields.” FEDS Working Paper 2014-052.
Note: For each maturity, the blue line indicates the sensitivity of forward rates to macroeconomic surprises. The yellow lines represent the associated confidence bands. When larger (smaller) than one, the sensitivity is higher (lower) than historical regularities. Vertical gridlines indicate the announcement dates for Outright Monetary Transactions (OMT), Forward Guidance (FG), and the Expanded Asset Purchase Programme (APP). Latest observation: February 2017.
My overall conclusion is that FCIs offer an information basis for measuring the quantum of financial stimulus that is too fragile at times, and – more often than not – they do not provide a robust benchmark for policy. To appreciate this last point, think of the example I just made. If the dominant factor explaining the increase in long-term yields is foreign forces, the change would be akin to a tightening and should counsel some offsetting monetary policy response. If the dominant factor is the improvement in domestic macroeconomic conditions, policy forbearance would be appropriate.
Finally, the connection between monetary policy and FCIs is a two-way road where, again, financial conditions incorporate the whole set of monetary policy instruments put in place, including forward guidance. Analysts thus have to account for the contribution of the existing instrument constellation to changes in FCIs so as to avoid circularity between the signals of the indicator and the conclusions on future policy conduct.
Monetary policy rules
Monetary policy rules, unlike FCIs, are designed to describe the systematic component of the central bank’s behaviour through time, and distil – from that behaviour – a broad paradigm for prudent monetary policy conduct that is usable for calibrating policy going forward. Their measurement scope is narrower than for the FCIs, as they concentrate on the very short-term interest rate that is the main operating target of a central bank in normal times. But their explicit normative focus and the link they establish between the policy instrument and the state of the macro-economy is potentially of great value for assessing monetary policy.
But, again, while they can certainly help lay down a shared conceptual ground for economists to start engaging in a disciplined conversation about the multiple trade-offs policy makers face and the policy choices they should make to resolve them, they are less helpful as a ready-to-use blueprint for policy design.
Why? Many central bankers, in past and more recent interventions, have emphasised the measurement issues that impede a mechanical use of policy rules in the tradition of John Taylor’s famous benchmark. Prominent among these is the need to scale that rule to a level of the short-term interest rate that is compatible with sustainable growth and price stability in the medium term. That scaling factor, which has been referred to as the natural or the equilibrium interest rate, is extremely influential in steering the policy implications that these rules can deliver.[5] While hard to estimate, the literature gives clear indications that the natural rate may vary over time and is likely to have fallen in recent years, due to declining productivity and demographic factors, which in turn would lower the end-point to which monetary policy would converge, once the economy is back to full capacity. I will not dwell on measurement issues today, but rather concentrate on one aspect of simple monetary policy rules that has been debated less intensely and concerns their usability as policy benchmarks in the day-to-day re-assessment of the policy stance.
As part of their strategies and tactics to fight risks of deflation and an environment of too low inflation, in the past many central banks have reduced their traditional short interest rate operating targets to levels close to their lower bound and have complemented the easing impulse offered by these rate reductions with a host of other measures. The ECB has deployed a set of mutually reinforcing instruments, including long-term conditional funding operations for banks, negative short-term interest rates and direct outright interventions across the yield curve. Verbal indications about the expected horizon of our purchases, and about the level and direction of our policy interest rates looking into the future are also critical component of that strategy.
The non-standard ECB instruments can, to some extent, act as substitutes. For instance, APP and the TLTROs both foster a rebalancing in banks’ balance sheets toward loans – even though the channels differ: APP promotes bank lending by lowering the return on banks’ securities portfolios, while the TLTROs produce the same outcome by increasing the risk-adjusted return on loans.
When instruments are substitutes, one can indeed conceive of exercises in which the degree and intensity with which each of them is applied is adjusted along an “equivalence frontier” of sort, altering the mix of the policy package without necessarily changing the overall quantum of stimulus that the entire policy package delivers. A Taylor rule could, in this case, assist in benchmarking the level of the very short-term interest rate that is the traditional target of policy. The remaining components of the policy package could thus be treated as a residual, after the setting of the short-term interest rate is determined, and be calibrated such that they attain the overall degree of accommodation indicated by the policy prescriptions originating from the Taylor rule.
But, for the most part, our policy instruments act as strong complements. For instance, the downward pressure that APP exerts on term premia is strengthened by the negative interest rate policy and the rate forward guidance that offers an expected horizon for continuing that policy in the near term. Negative remuneration on banks’ excess reserves induces lenders and other investors holding cash reserves to diversify away from liquidity into longer-dated assets. By demonstrating that short-term interest rates can be driven to levels below zero, the central bank can signal absence of non-negativity restrictions constraining the path of future short term rates looking forward. This bends the whole predictive distribution of future short-term interest rates down, which is another way of saying that the expectations channel of monetary policy and the forward guidance on policy rates are reinforced. Conversely, APP empowers the forward guidance on policy rates, as the credibility of indications about the setting of the policy rates in the future are almost certainly enhanced by provision of asset purchases today. These purchases are a concrete demonstration of a desire to provide additional stimulus. Clearly, forward guidance on policy rates and APP are connected by a solid two-way interaction. That is: asset purchases strengthen the signalling effect of rate forward guidance, while rate forward guidance and the negative deposit facility rate reinforce the impact of purchases.
These strong complementarities among instruments mean two things. First, each instrument within the policy parcel has a net value that would be diminished if used independently of – and in isolation from – any of the other instruments. Second, the determination of the intentional horizon for applying each of them can only be the result of an integrated decision process whereby these intimate interactions are duly internalised.
I will now expand on the first aspect and try to bridge it to the problem that, in my view, undermines the policy benchmarking function of simple policy rules in unconventional monetary policy times like the present. At the end of my remarks, I will come back to the second aspect and link it to the current debate on timing and sequencing of monetary policy normalisation.
At present, the intimate complementarity between asset purchases and the rate forward guidance makes monetary policy highly history dependent.[6] The macroeconomic outcomes that we observe today are as much the results of actions that we are taking at present, as the on-going lagged impact of the expectations that our past actions and communication have generated. This is valid always and everywhere, because the signalling content of monetary policy decisions is a predominant attribute of transmission. But it becomes a particularly crucial aspect of policy in the wake of the major disruptions of the past years, which have set in motion forces that still restrain the economy and will probably take more time to dissipate. The severity and persistence of the shocks that have tended to destabilise the economy in the past few years have forced a particularly bold, persistent and steady-handed approach to monetary policy. A large part of what we do today is a follow-through on a course of action that was carefully charted and communicated in the past. Likewise, a great deal of the macroeconomic outcomes that we observe today is due to those plans, and the subsequent actions that have been enacted to carry them out.
In this light, it becomes easier to appreciate how simple policy rules of the type John Taylor has studied, if used outside a general equilibrium framework, can lead policy astray. The reason is that, by design, they ignore the complementarities among instruments and they offer prescriptions on one instrument as if it could be moved in isolation. And, if employed outside an articulated “optimal control” framework, they are “memory-less”, i.e. they forget about past states of the world which may still be relevant for determining present-day conditions and monetary policy actions.
To be more concrete, if used outside a model, these rules tend to prescribe a firming of policy as soon as the economy starts improving. But, in the presence of non-standard measures, this improvement arises precisely because of the set of policy initiatives that the central bank has put in place in the past, including its rate forward guidance. A typical Taylor rule does not keep track of the accumulated deviations of the target variables that arise from the limitations encountered by standard monetary policy at the lower bound.[7] A deviation from the path of policy that is consistent with our past communication is not only costly in terms of policy credibility in general. It would also scale back an important source of stimulus that is behind the performance of the economy that we observe today.
How can we retain the most attractive attributes of a Taylor rule – the fact that it encapsulates a paradigm of robust and stability-inducing monetary policy conduct – and, at the same time, address its limitations?
Many of the problems that plague Taylor rules can find solutions within a general equilibrium framework where all the feed-forward and feed-back channels of interactions among policy instruments, financial prices and the economy can be internalised in a consistent manner. In fact, virtually all structural models – whether of a stochastic general equilibrium structure with a strong forward-looking set-up, or of a more hybrid nature with a focus on time-series coherence – are “closed” with a Taylor rule of one or another specification. Within those models in which a Taylor rule “represents” monetary policy, the typical exercise that can answer the normative issue is the following: how would inflation over the medium term horizon react if we were to adjust our policy instruments, one at a time or all of them contemporaneously? This is the philosophy behind our third criterion for declaring a “sustained adjustment in the path of inflation”, which is a pre-condition for starting to normalise our purchases and, indirectly, for starting to normalise our policy rates – through the sequencing we expect to follow toward a more normal configuration of policy.
Conducting this type of exercise today, we see that the combination of instruments that are currently in place, including forward indications about the horizon over which these instruments will still be used, is sufficiently supportive to put inflation on a rising path that will bring it to levels close to 2% over a time frame that is compatible with our definition of medium term. But, and this is our third criterion for a sustained adjustment, if we were to firm policy by scaling back the stimulus provided, that inflation path would likely stall and relapse. The projected path of inflation remains conditional on very easy financing conditions, for which monetary policy plays a key role.
Conclusions
In conclusion, let me return to the sequencing issue. Communication about the intentional horizon of net asset purchases and expected future path of the policy rates is a key component of the policy strategy that started in 2014. The reason is simple and, once more, has to do with instrument complementarity. Above and beyond any signalling content they may have on the intention of the central bank to provide accommodation, asset purchases add stimulus principally by squeezing the term premia priced into longer-dated securities. However, absent reassurance that policy rates will remain anchored around their lower bound for the entire life of the net purchases, the impact of asset purchases may be partly neutralised. The downward impact of purchases on long-term interest rates via compression of term premia will be offset by the upward pressure that will stem from the steeper path of the expected short term interest rates. Moreover, absent reassurance on the rate path, the term premium itself may increase if the future course of the policy rates becomes more uncertain, despite the contrary effect of the purchases. If investors start perceiving that the path of the policy rate is subject to upward uncertainty, the compensation for interest rate risk – i.e. the term premium – will have to increase. Again, long-term interest rates will be pushed higher and asset purchases will become less effective.
These strong complementarities between instruments are behind the way the expected plans for the evolution of APP and the policy rates have been lined up in time in the Governing Council’s intentions. In our expectation, the policy interest rate will remain at present or lower levels for an extended period of time and well past the horizon of our net asset purchases. This forward guidance implies a sequencing between the interest rate policy and the quantitative policy that can most efficiently internalise and exploit the intimate complementarities between these two key components of our current stance.