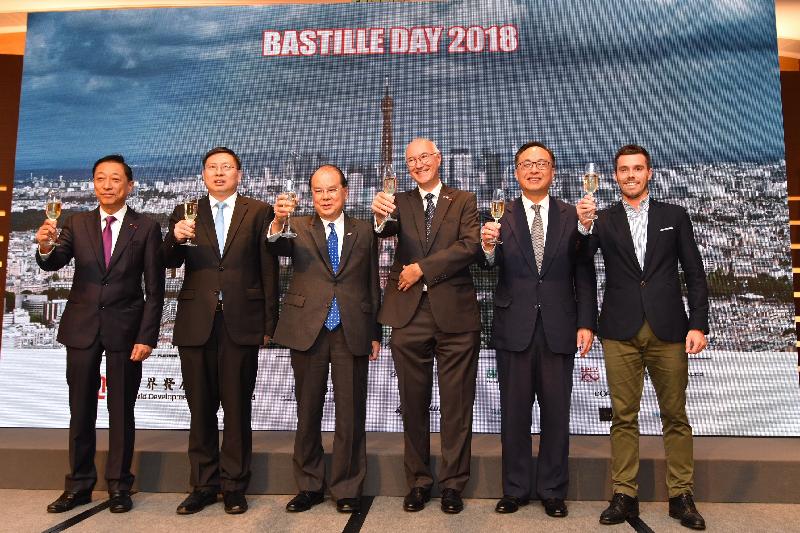
Following is the speech by the Chief Secretary for Administration, Mr Matthew Cheung Kin-chung, at the French National Day 2018 reception today (July 13).
Consul General (Consul General of France in Hong Kong and Macau, Mr Eric Berti), ladies and gentlemen,
Good evening. It is my honour to join you all tonight to commemorate the storming of the Bastille on 14 July, 1789, marking the birth of the French Republic.
Whilst there is no Parisian grand parade to celebrate the National Day of France tonight, this Bauhinia Room is blazed with vivid colours and high spirits to grace this auspicious occasion and, no less important, renew the long-established strong ties that have distinguished relations between France and Hong Kong.
Those ties continue to reward us both. France is Hong Kong’s third largest merchandise trade partner within the European Union. Last year, our bilateral merchandise trade totalled nearly HK$87 billion, or an increase of nearly 14 per cent over 2016.
Turning to investment, French inward direct investment into Hong Kong stood at HK$77 billion at the end of 2016. French companies in Hong Kong flourish and thrive, with 800 French companies counting Hong Kong as home and about 170 of them choosing Hong Kong as their regional headquarters or offices.
The close and lasting bond between Hong Kong and France explains why our Chief Executive, Mrs Carrie Lam, spent a highly productive but hectic week in France just last month. Her schedule took her to Bordeaux, one of the world’s most renowned wine-and-dine cities, to witness the signing of a Memorandum of Understanding between the Hong Kong Tourism Board and their counterparts of the Bordeaux Métropole. The agreement will no doubt boost bilateral co-operation in wine and food tourism and at the same time expand wine education and manpower training between the two places. I must hasten to add that our wine imports from France exceeded HK$7 billion in 2017 or a nearly 700 per cent increase over the past decade. What is more exciting is that France captured a nearly 60 per cent share of our total wine imports last year.
During her visit in France, the Chief Executive visited the headquarters of Airbus Helicopters outside Marseille to accept three brand-new H-175 helicopters on behalf of our Government Flying Service. We are expecting another four new helicopters to be delivered by the end of this year. These new helicopters are indeed a testimony of the successful East-West co-operation since our motherland contributed to the airframe manufacturing even though the production was mainly undertaken by Airbus Helicopters.
Flying down to Paris, the Chief Executive witnessed the signing of a co-operation agreement between the Hong Kong Science and Technology Park, the University of Hong Kong and Institut Pasteur. We have enjoyed a long and rewarding collaboration with Institut Pasteur, including the HKU-Pasteur Research Pole which specialises in the study of infectious diseases. We are hopeful that the Institut will expand its R&D in Hong Kong, in areas ranging from healthcare technology to artificial intelligence (AI) and robotics.
In parallel, the Hong Kong Special Administrative Region Government has set aside funds for two major research clusters: one focused on healthcare technology and the other on AI and robotics. We will continue to promote innovation and technology development in Hong Kong, with a view to attracting world-class scientific research institutions and technology companies to Asia’s world city.
The Guangdong-Hong Kong-Macao Bay Area in which Hong Kong will play a key role is destined to rise as Asia’s Silicon Valley. The city cluster, covering Hong Kong, Macao and nine prosperous Guangdong cities, will leverage on the unique strengths and advantages of each partner city, and boasts a GDP of US$1.5 trillion and a population of 68 million spread over 56 000 square kilometres. Hong Kong and Shenzhen are already working on an outsized technology park at full steam. Located close to the boundary with Shenzhen, the 87-hectare park will open in phases, beginning in 2022. Once it is up and running, it is expected to inject more than US$7 billion a year into Hong Kong’s economy. Beyond technology, the Bay Area will count on Hong Kong’s financial services capacity to power business opportunities.
Our motherland’s far-reaching Belt and Road Initiative will create enormous opportunities for our next generation. As a leading international financial and services hub, Hong Kong has the talent, the experience and the connections to bring multinational partners together and ensure both project financing and implementation. French expertise is most welcome to partner with Hong Kong to seize the vast opportunities that the Bay Area and the Belt and Road Initiative will offer us.
I can reassure our friends from France that they will certainly feel very much at home in Hong Kong. Our French community amounts to 25 000 French nationals, forming a unique “mini-France” in our city landscape. They may initially be attracted by the business opportunities, but they stay for the lifestyle and the confidence they have in Hong Kong. There is good reason for both.
Based on 148 000 interviews with adults in 142 countries and areas, Gallup’s 2018 Global Law and Order Report ranked Hong Kong third in the world as the city “most likely to feel safe in”. When it comes to lifestyle, Hong Kong is blessed with Le French May, one of the largest annual events on Asia’s cultural calendar, and Le French GourMay, a food and wine festival perfectly attuned to the cosmopolitan hearts and appetites of Asia’s world city.
Before I close, I must pay tribute to Eric Berti for the great efforts made in strengthening the relations between Hong Kong and France. Eric will leave Hong Kong soon and I wish him all the best in his new endeavour. The universal culture of sport. France will play Croatia for the 2018 World Cup championship in Moscow this Sunday – France’s third World Cup final appearance in 20 years. I wish the French team every success in Moscow.
On this happy note, please join me in a toast. To the Republic of France, and to the people of France, on your National Day.
Cheers!
read more


