SCED visits Tsuen Wan District (with photos)

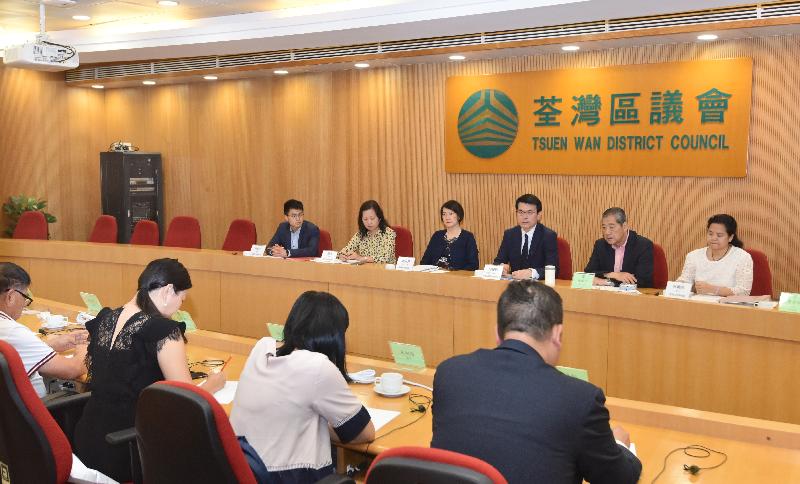
     The Secretary for Commerce and Economic Development, Mr Edward Yau, visited Tsuen Wan District today (September 20) to get a better grasp of the district's latest developments. He met with members of the Tsuen Wan District Council (TWDC) and visited the Sam Tung Uk Museum, the Hong Kong Intangible Cultural Heritage Centre and a co-working space.

     Mr Yau first met with TWDC members to exchange views on developments and issues of concern in the district, including matters relating to telecommunications, broadcasting and tourism development.

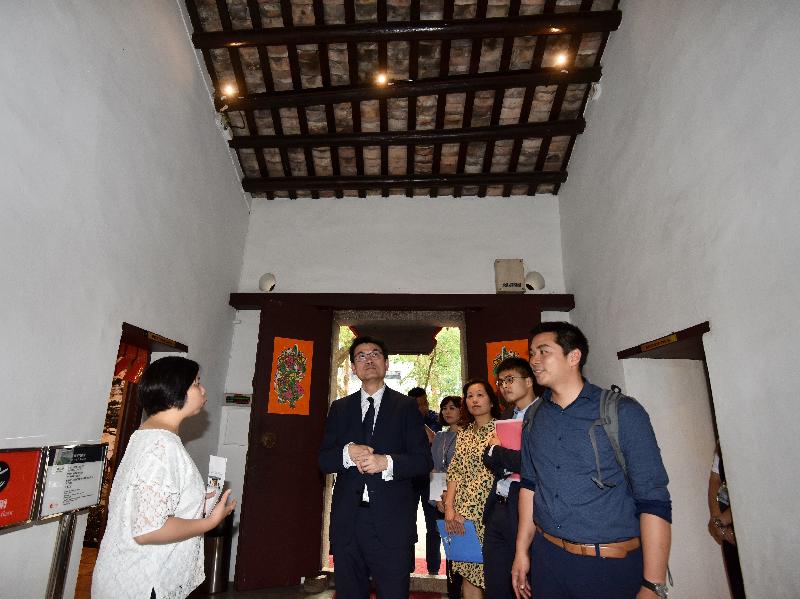
     Mr Yau then proceeded to visit the Sam Tung Uk Museum. He toured the exhibition and learnt about the architectural layout of the village and its unique living spaces. Sam Tung Uk is a 200-year-old Hakka walled village declared a historical monument and converted into the Sam Tung Uk Museum after restoration. Visitors can know more about the unique culture of walled villages.

     Mr Yau also took the chance to pay a visit to the Hong Kong Intangible Cultural Heritage Centre, which was set up at the Sam Tung Uk Museum by the Intangible Cultural Heritage Office. He was briefed on how the Centre enhances the public's understanding and awareness of Hong Kong's intangible cultural heritage through various educational and promotional activities.

     Mr Yau rounded off the district visit by meeting with young entrepreneurs at Smart-Space 8, a co-working space, to get to know their experiences in starting up businesses. Smart-Space 8 is a co-working space under the Space Sharing Scheme for Youth (SSSY) to support start-ups in emerging industries and young people who are starting their own businesses. The scheme provides supporting services including entrepreneurial training to help young entrepreneurs to make their dreams come true.

     Mr Yau said the SSSY is premised upon tripartite collaboration among the business sector, non-government organisations and the Government. The scheme provides practical support in terms of innovation and entrepreneurship under which young people pursuing careers in innovation and technology, creative industries, arts and culture can rent co-working spaces or studios with a lower-than-market price. He expressed the hope that more enterprises will join the scheme, thereby nurturing more local creative talent and driving the development of start-ups.

Photo  Photo  Photo  


Independent Review Committee on Hong Kong’s Franchised Bus Service to hold hearings to receive oral evidence from invited parties

The following is issued on behalf of the Independent Review Committee on Hong Kong's Franchised Bus Service:
 
     The Independent Review Committee on Hong Kong’s Franchised Bus Service will hold hearings to receive oral evidence from the invited parties as follows:
 

Date/Time Venue Invited Parties
September 24 (Monday)
(10am to 5.30pm, with a break between 1pm and 2.30pm)
Auditorium of the Central Government Offices, 2 Tim Mei Avenue, Tamar


Representatives of the Hong Kong Police Force


September 27
(Thursday)
(9am to 3.30pm, with a break between 1pm and 2.30pm)
Auditorium of the Central Government Offices, 2 Tim Mei Avenue, Tamar


Mr Mike Weston, an expert appointed by the Committee


     The Committee's rules of procedure for the receipt of oral evidence and notice to the public attending the hearings to receive oral evidence are available on the Committee's website (www.irc-bus.gov.hk/eng/press.html).

     Having received and considered written submissions from various interested parties, and in order to obtain further information, the Committee is in the process of inviting specific interested parties to give oral evidence to the Committee through nominated representatives. Thirteen hearings have been held so far to receive oral evidence from:

(A) Representatives of:

  • the Transport and Housing Bureau;
  • the Transport Department;
  • Kowloon Motor Bus Company (1933) Limited and Long Win Bus Company Limited;
  • the New World First Bus Services Limited and Citybus Limited;
  • the New Lantao Bus Company (1973) Limited;
  • Tai Po, Sha Tin and Sham Shui Po District Councils;
  • ZF Friedrichshafen AG and Openmatics s.r.o.;
  • the Community for Road Safety;
  • the Motor Transport Workers General Union, including its sub-unions of Citybus Branch, KMB Branch, Long Win Bus Branch, New Lantao Bus Branch and New World Bus Branch;
  • The Federation of Bus Industry Trade Unions, including its members of KMB Staff Union, New World First Bus Company Staff Union and Citybus Limited Employees Union;
  • the KMB Employees Union;
  • the Staff Rights Association of KMB;
  • the Monthly-Rated Drivers Union; and
  • the Part-time Drivers Union

 
(B) Former employees of the KMB:

  • Mr Alok Jain; and
  • Mr Raymond Cheng
     

(C) Employees of the KMB:

  • Ms Debby Wong; and
  • Mr Kelvin Yeung

(D)  Expert appointed by the Committee:

  • Professor John Stanley

 
     A transcript of that evidence (and a translation in Chinese) is available on the Committee's website (www.irc-bus.gov.hk/eng/transcripts.html).

     The Committee wishes to invite family members of the victims and passengers on board the bus involved in the fatal incident on Tai Po Road, and other recent serious incidents involving franchised bus services, to attend the hearings, and invites them to contact the Secretariat in advance of the hearings if they wish to attend. Except for seats reserved for such persons as well as the media and specifically identified interested parties, all available seats in the hearing venues will be open to the public on a first-come, first-served basis. A registration counter will open at 9.30am on September 24 and 8.30am on September 27.

     Enquiries regarding the hearings may be directed to the Secretariat of the Committee at 2867 5324.


Suspected MERS case reported

     The Centre for Health Protection (CHP) of the Department of Health today (September 20) reported a suspected case of Middle East Respiratory Syndrome (MERS), and again urged the public to pay special attention to safety during travel, taking due consideration of the health risks in the places of visit. The case is detailed below: 
 

Sex Female
Age 25
Affected area involved Kuwait
High-risk exposure Nil
Hospital Princess Margaret Hospital
Condition Stable
MERS-Coronavirus preliminary test result Negative

     "Travellers to the Middle East should avoid going to farms, barns or markets with camels; avoid contact with sick persons and animals, especially camels, birds or poultry; and avoid unnecessary visits to healthcare facilities. We strongly advise travel agents organising tours to the Middle East to abstain from arranging camel rides and activities involving direct contact with camels, which are known risk factors for acquiring MERS Coronavirus (MERS-CoV)," a spokesman for the CHP said.    

     Locally, the CHP's surveillance with public and private hospitals, with practising doctors and at boundary control points is firmly in place. Inbound travellers and members of the public who recently visited the Middle East and developed fever or lower respiratory symptoms within 14 days will be classified as suspected MERS cases. They will be taken to public hospitals for isolation and management until their specimens test negative for MERS-CoV.

     Travellers to affected areas should maintain vigilance, adopt appropriate health precautions and take heed of personal, food and environmental hygiene. The public may visit the MERS pages of the CHP and its Travel Health Service, MERS statistics in affected areas, the CHP's Facebook Page and YouTube Channel, and the World Health Organization's latest news for more information and health advice. Tour leaders and tour guides operating overseas tours are advised to refer to the CHP's health advice on MERS.


Consumer Price Indices for August 2018

     The Census and Statistics Department (C&SD) released today (September 20) the Consumer Price Index (CPI) figures for August 2018. According to the Composite CPI, overall consumer prices rose by 2.3% in August 2018 over the same month a year earlier, slightly smaller than the corresponding increase (2.4%) in July 2018. Netting out the effects of all Government's one-off relief measures, the year-on-year rate of increase in the Composite CPI (i.e. the underlying inflation rate) in August 2018 was 2.6%. This increase was also slightly smaller than that in July 2018 (2.7%), mainly due to the smaller increases in the charges for package tours. Also relevant was the decreases in inbound and outbound transport fares.

     On a seasonally adjusted basis, the average monthly rate of increase in the Composite CPI for the three-month period from June to August 2018 was 0.2%, the same as that for the three-month period from May to July 2018. Netting out the effects of all Government's one-off relief measures, the average monthly rate of increase in the Composite CPI for the three-month period from June to August 2018 was 0.2%, the same as that for the three-month period from May to July 2018.

     Analysed by sub-index, the year-on-year rates of increase in the CPI(A), CPI(B) and CPI(C) were 2.5%, 2.2% and 2.0% respectively in August 2018, as compared to 2.5%, 2.3% and 2.3% respectively in July 2018. Netting out the effects of all Government's one-off relief measures, the year-on-year rates of increase in the CPI(A), CPI(B) and CPI(C) were 2.8%, 2.6% and 2.3% respectively in August 2018, as compared to 2.8%, 2.7% and 2.6% respectively in July 2018.

     On a seasonally adjusted basis, for the three-month period from June to August 2018, the average monthly rates of increase in the seasonally adjusted CPI(A), CPI(B) and CPI(C) were 0.2%, 0.2% and 0.1% respectively. The corresponding rates of increase for the three-month period from May to July 2018 were all 0.2%. Netting out the effects of all Government's one-off relief measures, the corresponding average monthly rates of increase in the seasonally adjusted CPI(A), CPI(B) and CPI(C) for the three-month period from June to August 2018 were 0.2%, 0.2% and 0.1% respectively, and the corresponding rates of increase for the three-month period from May to July 2018 were all 0.2%.

     Amongst the various CPI components, year-on-year increases in prices were recorded in August 2018 for food (excluding meals bought away from home) (4.5% in the Composite CPI and 4.2% in the CPI(A)); electricity, gas and water (3.4% in the Composite CPI and 3.8% in the CPI(A)); meals bought away from home (3.0% in the Composite CPI and 3.1% in the CPI(A)); housing (2.3% in the Composite CPI and 2.6% in the CPI(A)); alcoholic drinks and tobacco (2.3% in the Composite CPI and 2.5% in the CPI(A)); clothing and footwear (1.9% in the Composite CPI and 2.3% in the CPI(A)); miscellaneous services (1.5% in the Composite CPI and 1.2% in the CPI(A)); miscellaneous goods (1.4% in the Composite CPI and 1.8% in the CPI(A)) and transport (1.4% in the Composite CPI and 1.2% in the CPI(A)).

     On the other hand, year-on-year decrease in prices was recorded in August 2018 for durable goods (-1.9% in the Composite CPI and -1.6% in the CPI(A)).  

     Taking the first eight months of 2018 together, the Composite CPI rose by 2.3% over a year earlier. The corresponding increases in the CPI(A), CPI(B) and CPI(C) were 2.5%, 2.2% and 2.2% respectively. Netting out the effects of all Government's one-off relief measures, the Composite CPI, CPI(A), CPI(B) and CPI(C) rose by 2.5%, 2.7%, 2.5% and 2.4% respectively in the first eight months of 2018 over a year earlier.

     For the three months ended August 2018, the Composite CPI rose by 2.4% over a year earlier, while the CPI(A), CPI(B) and CPI(C) rose by 2.5%, 2.3% and 2.2% respectively. The corresponding increases after netting out the effects of all Government's one-off relief measures were 2.6%, 2.9%, 2.7% and 2.5% respectively.

     For the 12 months ended August 2018, the Composite CPI was on average 2.1% higher than that in the preceding 12-month period. The respective increases in the CPI(A), CPI(B) and CPI(C) were 2.2%, 2.0% and 2.0% respectively. The corresponding increases after netting out the effects of all Government's one-off relief measures were 2.2%, 2.3%, 2.1% and 2.1% respectively.

Commentary

     A Government spokesman said that the underlying inflationary pressure held largely steady in recent months. On a year-on-year basis, the underlying inflation rate eased slightly in August, thanks largely to the smaller increase in the charges for package tours and the decrease in inbound and outbound transport fares, which slightly outweighed the faster increase in the private housing rent component.

     Looking ahead, inflationary pressure is expected to increase modestly in the coming months, alongside the gradual rise in global inflation and continued feed-through of earlier rises in fresh-letting residential rentals. Yet, the inflation rate should stay within a moderate range for 2018 as a whole. The Government will continue to monitor the situation closely, particularly the impact on the lower-income people.

Further information

     The CPIs and year-on-year rates of change at section level for August 2018 are shown in Table 1. The time series on the year-on-year rates of change in the CPIs before and after removing the effects of all Government's one-off relief measures are shown in Table 2. For discerning the latest trend in consumer prices, it is also useful to look at the changes in the seasonally adjusted CPIs. The corresponding time series on the average monthly rates of change during the latest three months for the seasonally adjusted CPIs are shown in Table 3. The rates of change in the original and the seasonally adjusted Composite CPI and the underlying inflation rate are presented graphically in Chart 1.

     More detailed CPI data (including year-on-year comparison, month-to-month comparison, seasonally adjusted data series and the CPIs by the Classification of Individual Consumption According to Purpose (COICOP)) are available in the monthly reports. Users can download the August 2018 issue of the "Monthly Report on the Consumer Price Index" (www.censtatd.gov.hk/hkstat/sub/sp270.jsp?productCode=B1060001), the time series of CPIs at detailed level (www.censtatd.gov.hk/hkstat/sub/sp270.jsp?productCode=D5600001), the time series of CPIs at COICOP division level (www.censtatd.gov.hk/hkstat/sub/sp270.jsp?productCode=D5600002) and the time series of CPIs after netting out the effects of all Government's one-off relief measures (www.censtatd.gov.hk/hkstat/sub/sp270.jsp?productCode=D5600003) free of charge at the website of the C&SD.

     For enquiries about the CPIs, please contact the Consumer Price Index Section of the C&SD (Tel: 3903 7374 or email: cpi@censtatd.gov.hk).


Volume and price statistics of external merchandise trade in July 2018

     Further to the external merchandise trade statistics in value terms for July 2018 released earlier on, the Census and Statistics Department (C&SD) released today (September 20) the volume and price statistics of external merchandise trade for that month.
 
     In July 2018, the volume of Hong Kong's total exports of goods increased by 7.5% over July 2017. Concurrently, the volume of imports of goods increased by 11.5%.
 
     Comparing the first seven months of 2018 with the same period in 2017, the volume of Hong Kong's total exports of goods increased by 6.8%. Concurrently, the volume of imports of goods increased by 8.4%.
 
     Comparing the three-month period ending July 2018 with the preceding three months on a seasonally adjusted basis, the volume of total exports of goods increased by 0.6%. Concurrently, the volume of imports of goods increased by 0.1%.
 
     Changes in volume of external merchandise trade are derived from changes in external merchandise trade value with the effect of price changes discounted.
 
     Comparing July 2018 with July 2017, the prices of total exports of goods increased by 2.4%. Concurrently, the prices of imports of goods increased by 2.6%.
 
     As regards price changes in the first seven months of 2018 over the same period in 2017, the prices of total exports of goods increased by 2.5%. Concurrently, the prices of imports of goods increased by 2.6%.
 
     Price changes in external merchandise trade are reflected by changes in unit value indices of external merchandise trade, which are compiled based on average unit values or, for certain commodities, specific price data.
 
     The terms of trade index is derived from the ratio of price index of total exports of goods to that of imports of goods. Compared with the same periods in 2017, the index decreased by 0.2% and 0.1% in July 2018 and in the first seven months of 2018 respectively.

     Changes in the unit value and volume of total exports of goods by main destination are shown in Table 1.
 
     Comparing July 2018 with July 2017, double-digit increases were recorded for the total export volume to Vietnam (+25.9%) and India (+14.2%). Concurrently, the total export volume to the mainland of China (the Mainland) and the USA increased by 9.3% and 6.5% respectively. On the other hand, the total export volume to Japan decreased by 9.4%.
 
     Over the same period of comparison, the total export prices to the USA, the Mainland and Japan increased by 3.7%, 3.3% and 2.4% respectively. On the other hand, the total export prices to Vietnam and India decreased by 2.1% and 4.1% respectively.
 
     Changes in the unit value and volume of imports of goods by main supplier are shown in Table 2.
 
     Comparing July 2018 with July 2017, a double-digit growth of 18.4% was recorded for the import volume from Korea. Concurrently, the import volume from Taiwan, Japan, the Mainland and Singapore increased by 9.6%, 8.0%, 7.1% and 1.0% respectively.
 
     Over the same period of comparison, the import prices from Korea, the Mainland, Japan and Singapore increased by 7.8%, 2.8%, 2.8% and 2.4% respectively. On the other hand, the import prices from Taiwan decreased by 0.4%.
 
Further information
 
     Details of the above statistics are published in the July 2018 issue of "Hong Kong Merchandise Trade Index Numbers". Users can download the publication free of charge at the website of the C&SD (www.censtatd.gov.hk/hkstat/sub/sp230.jsp?productCode=B1020006).
 
     Enquiries on merchandise trade indices may be directed to the Trade Analysis Section (1) of the C&SD (Tel: 2582 4918).