Appeal for information on missing man in Mong Kok (with photo)
Police today (January 22) appealed to the public for information on a man who went missing in Mong Kok. Yeung Chun-wai, aged 24, went missin… read more


Police today (January 22) appealed to the public for information on a man who went missing in Mong Kok. Yeung Chun-wai, aged 24, went missin… read more
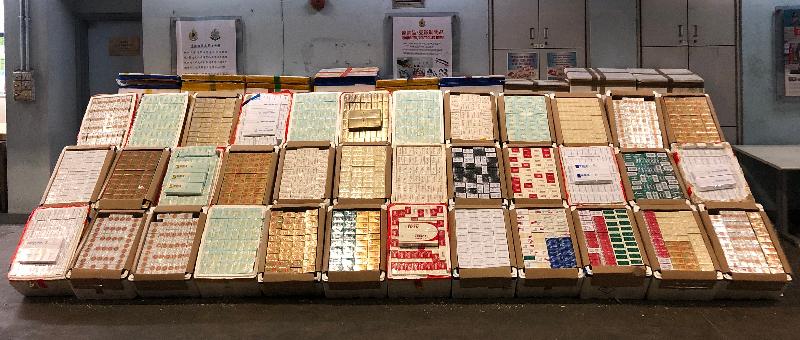
Hong Kong Customs yesterday (January 21) seized about 1.6 million suspected illicit cigarettes with an estimated market value of about $4.4 million and a duty potential of about $3.1 million at Man Kam To Control Point.
Customs officers intercepted an incoming truck declared as carrying vegetables at Man Kam To Control Point yesterday. After inspection, Customs officers found the batch of suspected illicit cigarettes in 179 foam boxes mix-loaded with 321 boxes of vegetables onboard the truck.
The 61-year-old male driver was arrested and the truck was detained. Investigation is ongoing.
Smuggling is a serious offence. Under the Import and Export Ordinance, any person found guilty of importing or exporting unmanifested cargo is liable to a maximum fine of $2 million and imprisonment for seven years.
Members of the public may report any suspected illicit cigarette activities to the Customs’ 24-hour hotline 2545 6182 or its dedicated crime-reporting email account (crimereport@customs.gov.hk).
The Food and Environmental Hygiene Department (FEHD) launched the Green Burial Central Register today (January 22) to enable members of the public to register early their wish for green burial. &nb… read more
The Census and Statistics Department (C&SD) released today (January 22) the Consumer Price Index (CPI) figures for December 2018. According to the Composite CPI, overall consumer prices rose by 2.5% in December 2018 over the same month a year earlier. The increase was slightly smaller than that in November 2018 (2.6%), mainly due to the smaller increases in private housing rentals and the costs for meals bought away from home. Netting out the effects of all Government’s one-off relief measures, the year-on-year rate of increase in the Composite CPI (i.e. the underlying inflation rate) in December 2018 was 2.9%, remaining virtually unchanged as compared to November 2018.
On a seasonally adjusted basis, the average monthly rate of increase in the Composite CPI for the three-month period from October to December 2018 was 0.2%, and that for the three-month period from September to November 2018 was 0.3%. Netting out the effects of all Government’s one-off relief measures, the corresponding rates of increase were also 0.2% and 0.3% respectively.
Analysed by sub-index, the year-on-year rates of increase in the CPI(A), CPI(B) and CPI(C) were 3.0%, 2.4% and 2.2% respectively in December 2018, as compared to 3.0%, 2.4% and 2.3% respectively in November 2018. Netting out the effects of all Government’s one-off relief measures, the year-on-year rates of increase in the CPI(A), CPI(B) and CPI(C) were 3.3%, 2.8% and 2.5% respectively in December 2018, as compared to 3.3%, 2.8% and 2.6% respectively in November 2018.
On a seasonally adjusted basis, for the three-month period from October to December 2018, the average monthly rates of increase in the seasonally adjusted CPI(A), CPI(B) and CPI(C) were 0.1%, 0.2% and 0.3% respectively. The corresponding rates of increase for the three-month period from September to November 2018 were 0.3%, 0.2% and 0.3% respectively. Netting out the effects of all Government’s one-off relief measures, the corresponding average monthly rates of increase in the seasonally adjusted CPI(A), CPI(B) and CPI(C) for the three-month period from October to December 2018 were 0.1%, 0.2% and 0.3% respectively, and the corresponding rates of increase for the three-month period from September to November 2018 were 0.3%, 0.2% and 0.3% respectively.
Amongst the various CPI components, year-on-year increases in prices were recorded in December 2018 for electricity, gas and water (3.8% in the Composite CPI and 4.2% in the CPI(A)); food (excluding meals bought away from home) (3.8% in the Composite CPI and 3.7% in the CPI(A)); miscellaneous services (3.4% in the Composite CPI and 2.4% in the CPI(A)); housing (2.9% in the Composite CPI and 4.2% in the CPI(A)); alcoholic drinks and tobacco (2.8% in the Composite CPI and 2.9% in the CPI(A)); meals bought away from home (2.5% in the Composite CPI and 2.6% in the CPI(A)); transport (1.8% in both the Composite CPI and CPI(A)) and miscellaneous goods (1.2% in the Composite CPI and 1.4% in the CPI(A)).
On the other hand, year-on-year decreases in prices were recorded in December 2018 for durable goods (-2.3% in the Composite CPI and -2.2% in the CPI(A)) as well as clothing and footwear (-1.5% in the Composite CPI and -1.9% in the CPI(A)).
In the fourth quarter of 2018, the Composite CPI rose by 2.6% over a year earlier, while the CPI(A), CPI(B) and CPI(C) rose by 3.1%, 2.4% and 2.3% respectively. The corresponding increases after netting out the effects of all Government’s one-off relief measures were 2.9%, 3.3%, 2.8% and 2.6% respectively.
For 2018 as a whole, the Composite CPI was on average 2.4% higher than that in the preceding 12-month period. The respective increases in the CPI(A), CPI(B) and CPI(C) were 2.7%, 2.3% and 2.2% respectively. The corresponding increases after netting out the effects of all Government’s one-off relief measures were 2.6%, 2.9%, 2.6% and 2.4% respectively.
Commentary
A Government spokesman said that the underlying inflation rate held largely stable at 2.9% in December 2018. For 2018 as a whole, the underlying inflation rate averaged 2.6%.
In the near term, the upside risks to inflation should be contained, as imported inflation has stayed moderate and as pressures on local rentals have weakened somewhat of late. The Government will monitor the situation closely, particularly the impact on the lower-income people.
Further information
The CPIs and year-on-year rates of change at section level for December 2018 are shown in Table 1. The time series on the year-on-year rates of change in the CPIs before and after removing the effects of all Government’s one-off relief measures are shown in Table 2. For discerning the latest trend in consumer prices, it is also useful to look at the changes in the seasonally adjusted CPIs. The corresponding time series on the average monthly rates of change during the latest three months for the seasonally adjusted CPIs are shown in Table 3. The rates of change in the original and the seasonally adjusted Composite CPI and the underlying inflation rate are presented graphically in Chart 1.
More detailed CPI data (including year-on-year comparison, month-to-month comparison, seasonally adjusted data series and the CPIs by the Classification of Individual Consumption According to Purpose (COICOP)) are available in the monthly reports. Users can download the December 2018 issue of the “Monthly Report on the Consumer Price Index” (www.censtatd.gov.hk/hkstat/sub/sp270.jsp?productCode=B1060001), the time series of CPIs at detailed level (www.censtatd.gov.hk/hkstat/sub/sp270.jsp?productCode=D5600001), the time series of CPIs at COICOP division level (www.censtatd.gov.hk/hkstat/sub/sp270.jsp?productCode=D5600002) and the time series of CPIs after netting out the effects of all Government’s one-off relief measures (www.censtatd.gov.hk/hkstat/sub/sp270.jsp?productCode=D5600003) free of charge at the website of the C&SD.
For enquiries about the CPIs, please contact the Consumer Price Index Section of the C&SD (Tel: 3903 7374 or email: cpi@censtatd.gov.hk). read more
The effective exchange rate index for the Hong Kong dollar on Tuesday, January 22, 2019 is 104.1 (up 0.2 against yesterday’s index). read more